Showing posts with label on balance volume. Show all posts

Sunday, June 21, 2009

Chart of the Week: Lack of Volume and Breadth Threatens Bull Move

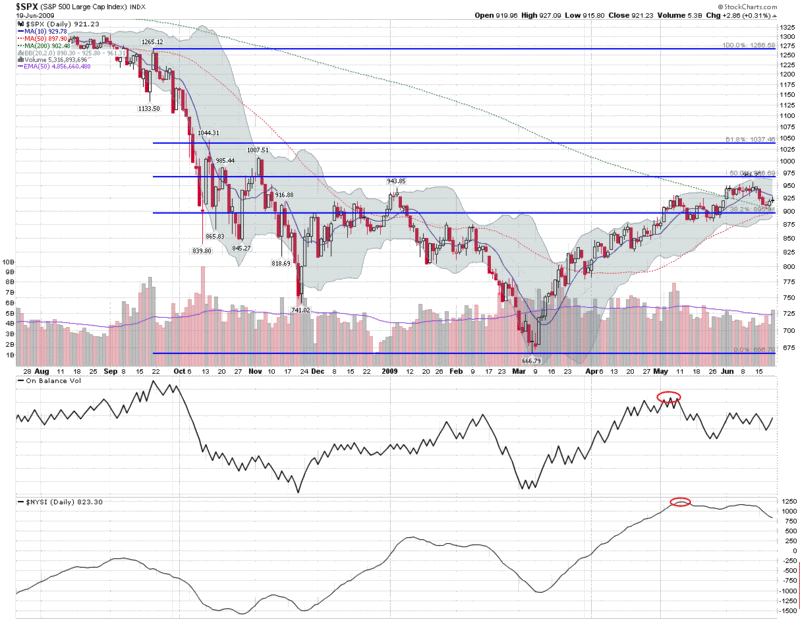
In the last few weeks, stocks have struggled to add to recent gains, suffering even more from a lack of buying interest than from selling pressure.

The chart of the week below is an attempt to use two basic indicators to capture the lack of volume and market breadth that has undermined the March to mid-June rally. As a measure of market volume, I have chosen to highlight on balance volume (OBV), which is a running total of the volume on up days minus the volume on down days. This indicator is excellent at highlighting trends which are at risk due to declining volume, which is exactly what the warning suggested when there was a peak in OBV during the first two weeks of May.

In a similar vein, the McClellan Summation Index (aka the NYSE Summation Index or NYSI) shows market breadth as derived from the net daily advancing stocks minus declining stocks. The McClellan Summation Index did turn up at the end of February, just before the March bottom and is generally an excellent tool for gauging trends in market breadth.

In addition to the May highs, note that both OBV and the McClellan Summation Index have recently made lower highs as well. While OBV shows some indications of steadying at current levels, the larger concern is the decline in market breadth issues highlighted by the McClellan Summation Index.

Like all indicators, these two are far from perfect, but they often provide important information about the decline in strength and potential for reversal in major trends.

For additional information on the subjects above try:


[graphic: StockCharts]

Thursday, May 21, 2009

VXX Volume Tops Million Mark as Investors Embrace New Volatility ETN

When I penned yesterday’s Record Volume in VXX, I had an inkling that the VIX-based volatility ETN might be having a coming out party soon. I did not, however, expect VXX to attract so much attention in just 24 hours.

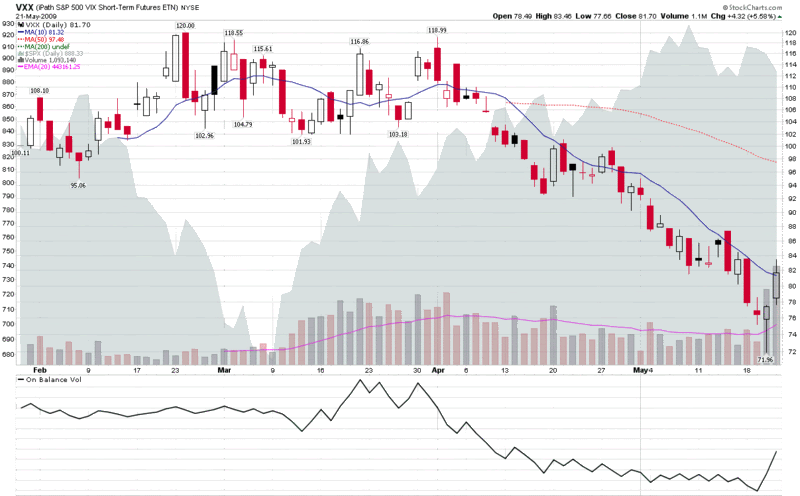
With today’s 1,094,140 shares traded, VXX is now officially in the big leagues and is sure to be added to the watch lists of many more retail investors and find itself in the repertoire of a wider variety of hedge funds.

The chart below updates the information from yesterday’s chart and adds an on balance volume study to highlight the strength of the move off of yesterday’s bottom.

For those who may be new to VXX, it is important to keep in mind that while there is strong directional agreement between VXX and the VIX (they move in the same direction in about 6 out of every 7 sessions), VXX tends to move at only half the rate the cash/spot VIX on a daily basis. So while VXX may lag the VIX in terms of a juice factor, it is probably the best way to trade volatility if one does not wish to do so in the options or futures market.

If this almost four-month-old volatility ETN were to have a motto, perhaps it would be, “When directionally correct is good enough!”

For more information on VXX, readers may also wish to check out:

[source: StockCharts]

Disclosure: Long VIX and VXX at time of writing.

Tuesday, May 27, 2008

Whither COF?

Ever since the onset of the credit crisis, it seemed like only a matter of time before problems in the area of home mortgages and HELOCs inevitably spread to credit cards. Given that Capital One Financial (COF) has dipped heavily into the subprime borrower market, it seems to reason that COF will be a large part of the collateral damage.

So far, COF has been able to keep charge offs at a manageable rate, one that was stable at 6.1% in March and April. This leveling off of the charge-offs in the most recent month prompted Goldman Sachs analyst Brian Foran to offer optimistically, “any sign that credit deterioration in U.S. card could be taking a breather is positive.”

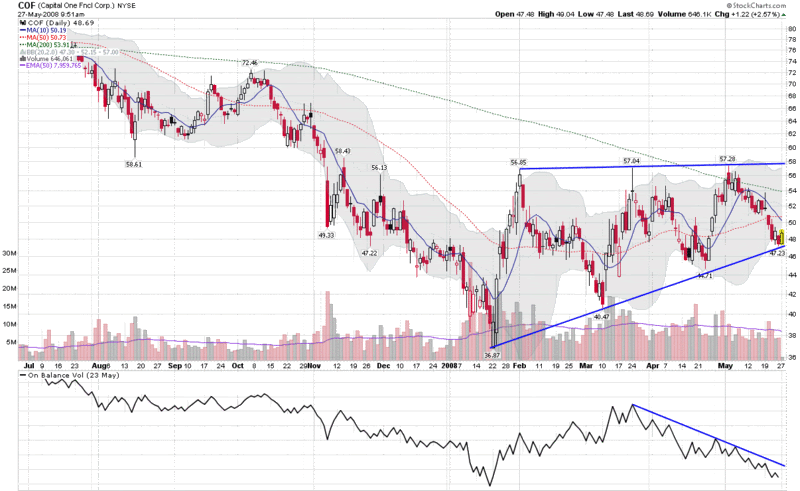
COF’s stock is currently 30% above the January low and has traded in an ascending triangle, as the chart below shows. While the stock is up this morning, it is testing the bottom of the triangle pattern. Ominously, on balance volume shows a significant divergence from the price pattern, with at least three significant distribution days (down on above average volume) over the past four weeks.

While XLF, XBD, C and LEH are all important indicators of the health of the financial sector, keep an eye on COF to see how the credit crisis is affecting subprime credit card holders.

DISCLAIMER: "VIX®" is a trademark of Chicago Board Options Exchange, Incorporated. Chicago Board Options Exchange, Incorporated is not affiliated with this website or this website's owner's or operators. CBOE assumes no responsibility for the accuracy or completeness or any other aspect of any content posted on this website by its operator or any third party. All content on this site is provided for informational and entertainment purposes only and is not intended as advice to buy or sell any securities. Stocks are difficult to trade; options are even harder. When it comes to VIX derivatives, don't fall into the trap of thinking that just because you can ride a horse, you can ride an alligator. Please do your own homework and accept full responsibility for any investment decisions you make. No content on this site can be used for commercial purposes without the prior written permission of the author. Copyright © 2007-2023 Bill Luby. All rights reserved.
 
Web Analytics