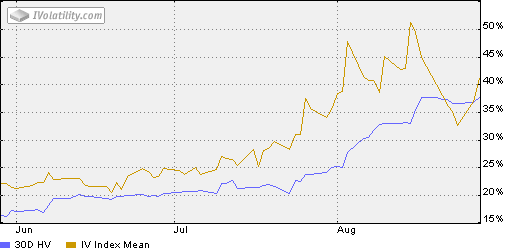
Watch XBD’s Implied Volatility
With the DJIA up almost 100 points right out of the gate, I was curious to see GS and BSC quickly fade from green to red – and that weakness reflected in the XBD (Broker/Dealer Index.)
Of course, you probably don’t have to hedge the entire market too catastrophe-proof your portfolio these days. You can probably accomplish the same task by erecting a safety net under just one or two sectors, such as the home builders or financial institutions. So I looked at my favorite bellwether, Goldman Sachs, to see how their implied volatility has fared in the past month or so. While it makes for an interesting visual, I have not included the Goldman chart because the company has a history of slipping punches. A better chart is the XBD, whose components include 12 companies in the broker-dealer space.
The iVolatility chart below shows implied and historical volatility for the XBD going back three months. Prior to July, the XBD IV spent 95% of the past year in a narrow 20-25 range. After topping 50 in mid-August, the XBD IV looked to be headed back down to 30 or so, until the recent spike left it over 40 yesterday.
While it is important to watch the price level of this index to see how it holds up at support levels such as 215 and 208, I also recommend keeping a weather eye on the XBD’s implied volatility to see what the trend and absolute levels of IV tell us about the thinking of options players. It is quite likely that the tip of the next iceberg may be found floating in the IV chart before it shows up on a price chart.


0 comments:
Post a Comment