What’s Working? A Sector Overview
Now that the broad indices have pulled back 10% or so and retraced about half of that drop, it is a good time to evaluate what is working in the current market environment.
One of the first places I look for clues is in sector and industry performance. With ETFs it is now possible to take the temperature of just about any micro-segment of the market you can think of, but for today I will stick to broader market segments.
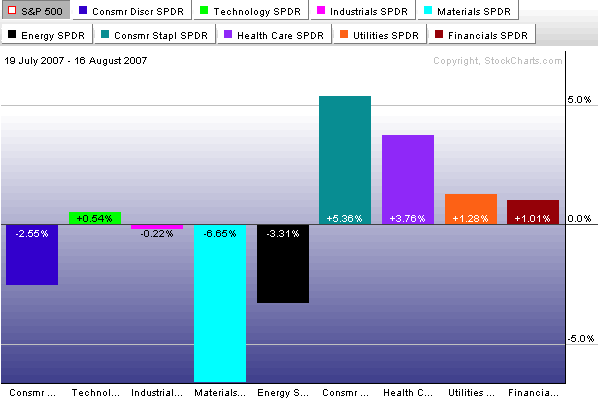
Looking at the peak to trough from July 19 to August 16, you can see that it is the materials sector (XLB) that suffered the most dramatic losses, dragged down by WY, IP, AA and the like.
In the five days since the market has bounced, the materials have been leading the bullish charge, with energy and financials lagging. Given the change in expectations about interest rates, it is not surprising to also see that utilities have had a much better week relative to the past month than the other sectors.
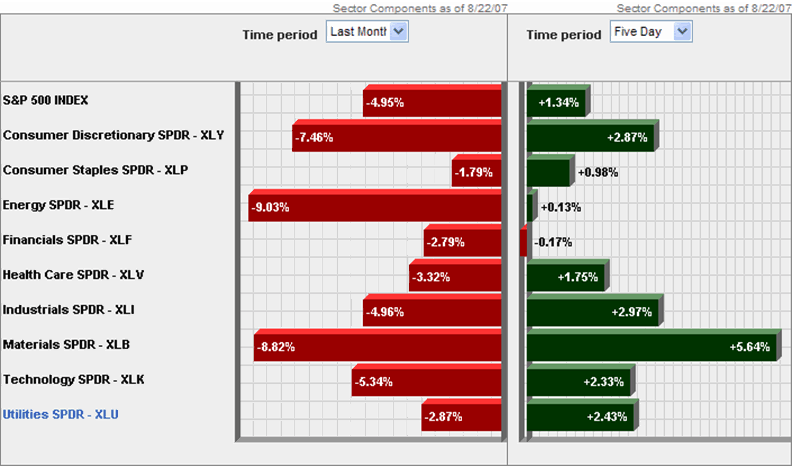
Going forward, look at the relative performance of materials, industrials (XLI) and technology (XLK) to provide some clues about global economic conditions and consumer discretionary (XLY) vs. consumer staples (XLP) to tell us something about the health of the consumer. If energy (XLE) and financials (XLF) can also start to rally, this may help us to discern the difference between a short-term bounce and the resumption of the bull market.


3 comments:
Bill, Great observations!! Thanks for the insights. Here's the link to the free Nasdaq sponsored ETF Heatmap to check the daily pulse.
http://screening.nasdaq.com/Heatmaps/Heatmap_ETF.asp
Thanks bzb. I intend to have a bunch of follow-up posts to this one and really delve into sector rotation, resources for same, etc. in the near future.
BTW, keep up the good work on your blog.
-Bill
For some reason, blogger truncated the URL for the heatmap site in bzb's post. For those who wish to check it out, try: NASDAQ ETF Dynamic Heatmap
Post a Comment