Showing posts with label EEM. Show all posts

Monday, August 24, 2015

Third Biggest and Second Longest SPX Peak to Trough Pullback Since March 2009

Nary a pullback goes by without at least a handful of requests to update my pullback table to help put the current pullback in perspective. Whether the current market action is best described as a pullback, correction or even bear market, I am happy to oblige.

For those who may new to this graphic, note that the table below includes only S&P 500 Index pullbacks from all-time highs and only those that go back to the March 2009 bottom. (Due to the all-time high requirement, I count back to the May 20th intraday high of 2134.72, even though almost all of the damage has been done in the past three days.) In terms of defining the minimum pullback for the table, here 2.75% seems to be a natural cutoff, but I am more apt to include smaller numbers if it took a relatively large number of days to arrive at the bottom. Of course the current move does more than just squeak in: it is now the third largest in terms of magnitude at 12.5% and second longest from peak to trough, at 66 days.

Worth noting is that the #1 pullback (21.6% in 2011) saw a peak VIX of 48.00 during the decline, while the #2 pullback (17.1% in 2010) coincided with a maximum VIX of 48.20. The current pullback falls into the #3 slot, while the #4 pullback (10.9% in 2012) saw a maximum VIX of only 26.71. For the record, today’s VIX intraday high of 53.29 is the highest VIX on record outside of the 2008-2009 financial crisis, with data going back to 1990.

SPX pullback table as of 082415

[source(s): CBOE, Yahoo, VIX and More]

While there is no obvious proximate cause of the current pullback and VIX spike, it is clear that concerns about slowing growth in China is the main source of investor anxiety.  Investors are clearly uneasy about various sub-plots related to the real level of China’s GDP, the impact of slowing Chinese growth on commodities and related markets, speculative excess and bubbles in China’s domestic stock market (ASHR) and real estate market (TAO) or broader concerns about the ability of the Chinese government to manage the economic transition from infrastructure-driven growth to growth based on domestic consumption.

Sharp selling and higher volatility has been present for many months in commodities and currencies. Only recently has the selling and higher volatility spilled over into Chinese equities and emerging markets as a whole. In fact, emerging markets have suffered greatly as of late, with the popular EEM ETF plummeting during the last two weeks and now down 32% from its April high. At the same time, the VXEEM emerging markets volatility index soared to record of 111.39 on an intraday basis today, crushing the previous all-time high of 86.44.

As with all big pullbacks, at this point we only know that we are closer to a bottom and have no assurance that the current bottom will hold. Most likely it will be tested again in the next day or two and traders will take their cues based on how well SPX 1867 holds up as support.
Related posts:

Disclosure(s): long EEM at time of writing

Monday, October 13, 2014

Largest SPX Pullback of 2014 Hits 6.4%

Every time there is a pullback, it seems as if I receive multiple requests for an updated version of the table below. With the S&P 500 index reeling and still trying to find a bottom, this looks like a good time to put the current pullback in the context of the 27 most significant peak-to-trough declines from new highs since the SPX bottomed in March 2009.

Note that the current 6.4% decline from the September 19th high of 2019 is roughly average in terms of duration, but makes it the second largest pullback in percentage terms since 2012, just eclipsing the January-February 2014 pullback, when emerging markets (EEM) and Crimea were weighing heavily on the minds of investors.

Keep in mind that as ugly has things have been in the SPX, the Russell 2000 small cap index (RUT) is down 13.8% since topping out in early July, while the NASDAQ composite index is down 8.5% since its mid-September top. Of course, some sectors have been hit even harder, with oil and gas exploration and production (XOP) down 33.3% from its 2014 high. Semiconductors (SMH) have declined 14.4% from their 2014 high, yet that high was established less than a month ago.

There is never an easy answer to the question of whether this has been enough pain to warrant a bottom, but after the events of the past week, all sorts of extreme scenarios now seem much more plausible.

SPXpullbackchartasof101314_zps5ff1c9f6[1]

[source(s): Yahoo, VIX and More]

Related posts:

Disclosure(s): none

Tuesday, July 2, 2013

Charting the Recent Decline of the BRIC Components

U.S. stocks are mostly green in today’s session, though there is a good deal of red in global stocks, notably in emerging markets, where the popular EEM emerging markets ETF is down close to 1% as I type this and the Brazil (EWZ) is down more than 2%.

In the chart below, I plot the recent decline of the four large BRIC emerging market country ETFs: Brazil (EWZ); Russia (RSX); India (EPI); China (FXI). While all four country ETFs have declined between 8% and 20% during the past six weeks, the various woes afflicting each country appear to be country-specific to a large extent, though obviously the issues affecting China’s manufacturing base and export market have a significant upstream impact on Brazil.

Emerging markets in general have been struggling as of late, but difficulties in Brazil, India and China have helped to fuel a global selloff.

Going forward, investors will be well-served to keep an eye on all four components of the BRIC block, as well as aggregated BRIC ETFs, such as the most popular issue in this space: the iShares MSCI BRIC Index (BKF).

For those who are interested in evaluating the risk and uncertainty in emerging markets in general, the recent VEXXM as a Measure of Emerging Markets Volatility and Risk is recommended reading for some background and information on VXEEM, the CBOE Emerging Markets ETF Volatility Index.

[source(s): StockCharts.com]

Related posts:

Disclosure(s): long EEM at time of writing

Thursday, June 20, 2013

VXEEM as a Measure of Emerging Markets Volatility and Risk

If you think U.S. stocks have been through a rough patch as of late, then you haven’t been paying attention to emerging markets stocks, where the popular EEM emerging markets ETF as fallen from a high of 42.96 on May 22nd to 37.02 earlier today – a 13.8% drop in less than one month. A large part of the problem has been the performance of the BRIC countries, where Brazil (EWZ), China (FXI) and India (EPI) are all acting as if they have been thrown overboard with anchors tied to their ankles, making Russia (RSX) look like the most stable investment of the group – which is quite a task.

Investors looking to monitor risk and uncertainty in Brazil and China are fortunate enough to have dedicated volatility indices based on the VIX methodology for EWZ and FXI. These volatility indices were created by the CBOE and use the tickers VXEWZ and VXFXI, respectively. For a more holistic view of risk and uncertainty in the emerging markets space, the best choice is probably VXEEM, the CBOE Emerging Markets ETF Volatility Index that is calculated based on options in EEM.

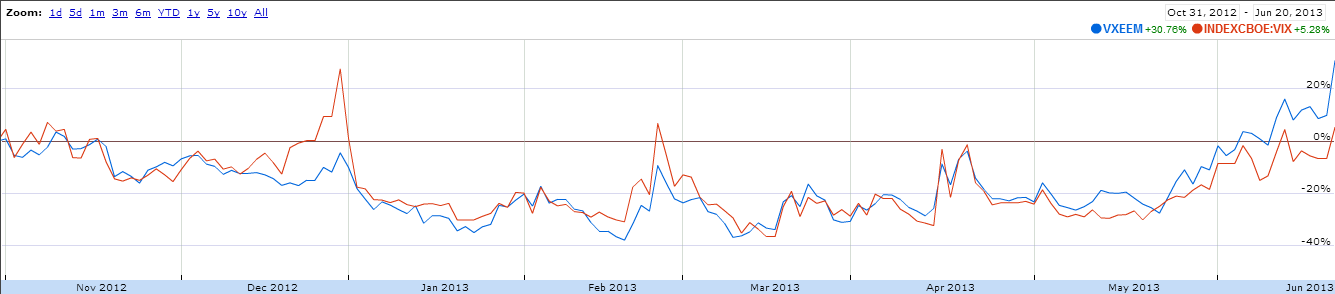
The chart below shows the relative performance of VXEEM and the VIX going back to the end of October 2012. Note that during toward the end of 2012, the debate over sequestration caused the markets to assign much more additional risk and uncertainty to U.S. stocks than to emerging markets stocks. During the course of the last month or two, this relationship has reversed and the risk and uncertainty associated with VXEEM has grown at a much faster rate than that of the VIX. On average, the absolute level of VXEEM is about 40% higher than that of the VIX. This week, however, VXEEM has been about 60% higher than the VIX.

On a related note, I find it interesting that S&P announced the launch of the S&P Emerging Markets Volatility Short-Term Futures Index just ten days ago. With that index in place, it would be relatively easy to create a futures-based emerging markets volatility ETP that would function in the same manner as VXX, but be based on VXEEM rather than the VIX. The biggest obstacle to this type of product is probably the current lack of liquidity in the VXEEM futures market.

[source(s): Google Finance]

Related posts:

Disclosure(s): short VXX at time of writing

Thursday, May 16, 2013

ETPs Turn to Selling Options to Generate Income

Not long after I penned The Options and Volatility ETPs Landscape, Credit Suisse (CS) added another buy-write / covered call ETP to the mix: the Credit Suisse Silver Shares Covered Call ETN (SLVO).

With SLVO, Credit Suisse is essentially extending the methodology they pioneered with the Credit Suisse Gold Shares Covered Call ETN (GLDI). In the case of both GLDI and SLVO, the ETPs are selling covered calls against the underlying commodity ETF for gold (GLD) and silver (SLV) in an effort to generate some income, and in so doing, choosing to forego some upside potential. In both instances, the ETP starts selling covered calls with 39 days until expiration and completes the sales with 35 days to expiration. One month later, the ETP buys these covered calls back over a period ranging from five to nine days prior to expiration. The net proceeds of these covered call transactions are then paid out as a monthly dividend. This dividend payment is not guaranteed and can fluctuate substantially from month to month. In the first four months following its launch, the monthly dividend for GLDI has been 0.1146, 0.0724, 0.1319 and 0.0572.

As silver is generally much more volatile than gold, SLVO elects to sell calls that are 6% out-of-the-money, while GLDI sells calls that are only 3% OTM. Other than this difference in strike selection or moneyness, the strategies employed by GLDI and SLVO are essentially the same.

Of course, covered call strategies work best when the price of the underlying is flat or when the underlying is appreciating slowly. During the recent sharp drop in GLD and SLV, the covered calls did provide a small amount of downside protection, but with GLD falling 13% over the course of just two trading days last month, the downside protection offered by a covered call was barely more than a rounding error. Covered calls and buy-write strategies generally outperform a long position in the underlying in all instances except when the underlying experiences a strong bull move.  (See graphic below for details.)

Thinking more broadly, the introduction of GLDI and SLVO should reinforce the idea that with ETPs now spanning a wide variety of asset classes and alternative investments, covered call strategies can be implemented in many non-traditional ways. The most popular of the traditional methods is PowerShares S&P 500 BuyWrite (PBP), which sells covered calls against the popular equity index. There is no reason, however, why there cannot be a similar product that sells covered calls against more volatile groups or sectors, such as emerging markets (EEM), small caps (IWM) or semiconductors (SMH), just to name a few. One can even bring alternative assets under the covered call tent. I’m not talking just about the likes of crude oil, copper or corn, but why not have covered calls on real estate, currencies or even volatility ETPs?

Better yet, why stop at covered calls? A strategy that I have discussed here on a number of occasions is selling cash-secured puts. The recent launch of U.S. Equity High Volatility Put Write Index ETF (HVPW) brought the put-write strategy into the ETP marketplace.  It is unfortunate that put-write strategies have not found a wider audience at this point or they too would be ripe for extending beyond the comfortable confines of the S&P 500 index.

Assuming this market eventually stops going up almost every day, investors are going to have to look for other ways to grow their portfolio and the scramble for yield will no doubt intensify. With ETPs now selling options to generate income, investors may want to look at some of the shrink-wrapped products mentioned above or consider how they might wish to implement similar strategies on their own.

[source(s): StockCharts.com]

Related posts:

Disclosure(s): long GLDI and HVPW at time of writing

Thursday, May 10, 2012

Looks Like Apple VIX (VXAPL) Futures Are Coming Soon

In case anyone missed it, I wanted to highlight a report yesterday from Reuters which quoted  Edward Tilly, President of CBOE Holdings, as saying that not only is the VIX product line ripe for expansion, but:

“We have benchmarks on a number of other products. I would point out one that is a favorite of mine that I wouldn't be surprised if I saw us launch in the near future - futures on Apple VIX.”

The Apple VIX (VXAPL) was launched in January 2011 along with similar single stock volatility indices for the following:

  • Amazon (AMZN): volatility ticker: VXAZN
  • Google (GOOG): volatility ticker: VXGOG
  • Goldman Sachs (GS): volatility ticker: VXGS
  • IBM (IBM): volatility ticker: VXIBM

A successful launch of futures on VXAPL might open the door for futures on one or more of the other single stock volatility indices above.

The chart below, courtesy of Livevol (StockCharts.com, you really should have VXAPL in your database) shows that VXAPL has tended to remain in the mid-30s, but has ranged between the high teens to the high 50s in the first 17 months of its life.

Recall that the CBOE Futures Exchange (CFE) launched futures on the emerging markets volatility index (VXEEM) in December 2011 and followed up by launching options on VXEEM at the end of January. The CFE also launched futures based on VXEWZ (CBOE Brazil ETF Volatility Index, which is based on EWZ) on February 21 and added options to VXEWZ on March 6.

If you enjoy trading volatility products, it looks like we may be entering the golden era of shrink-wrapped volatility indices, which can serve as a product platform for futures, options and even exchange-traded products. If you think VIX-based ETPs are fun, just wait until a VXAPL-based ETP is rolled out. Of course, if there is not enough demand for the futures and options, some of these ETPs may never see the light of day, so early adopters, don’t shy about hitting some of those bids.

Finally, on a somewhat tangential note, I think I received more emails on The Case for Selling Apple Puts than on any other post in the history of VIX and More. To all those who wrote, including those who elected to sell Apple (AAPL) puts, the current environment may be suitable for a revisiting this trading strategy.

Related posts:

[source(s): LivevolPro.com]

Disclosure(s): long AAPL at time of writing; Livevol and the CBOE are advertisers on VIX and More

Tuesday, January 31, 2012

CBOE Adds Options to Emerging Markets Volatility Index (VXEEM)

Earlier this month, the CBOE launched futures on the CBOE Emerging Markets ETF Volatility Index (VXEEM) and barely three weeks later, VXEEM options began trading today.

For more information on VXEEM options, which are based on the popular EEM emerging markets ETF, a good first stop is the CBOE’s VXEEM options product specification page. Of particular note is the fact the options expiration cycle is the same for VXEEM options as it is for the futures products. Additionally, VXEEM futures and options have the same expiration cycle as VIX futures and options, meaning that they will expire on Wednesdays (February 15, March 21, April 18 and May 16), with the options last traded on the Tuesday immediately following the expiration. For more information, check out the CBOE’s VXEEM splash page and information circular.

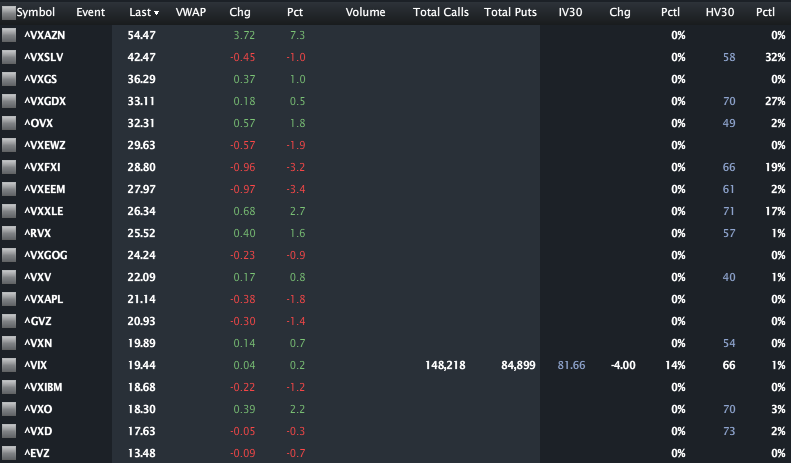
In the graphic below, courtesy of LivevolPro.com, I have collected closing data for some of the primary U.S. volatility indices, including those which are volatility indices for ETPs and single stocks. The indices are sorted from highest to lowest and provide a good sense of the market’s perceptions of relative risk across various stocks, groups of stocks (sectors and geographies) and asset classes.

Partly due to today’s earnings announcement, VXAZN, the volatility index for Amazon (AMZN) tops the list, with volatility indices for silver (VXSLV), Goldman Sachs (VXGS) and gold miners (VXGDX) rounding out the top four. VXEEM ranks eighth of the twenty volatility indices at 27.97 and currently carries a 43.8% premium to the VIX. Is that 43.8% premium too high? Too low? With VXEEM options (and futures) now you can not only express your opinion, but benefit financially if you are correct.

Related posts:

[source(s): LivevolPro.com]

Disclosure(s): Livevol is an advertiser on VIX and More

Friday, December 30, 2011

CBOE To Launch Futures on Emerging Markets Volatility (VXEEM)

One of the predictions I made for 2011 was that the trend toward what I have labeled “atomic volatility” (a lessening of the scope of the underlying for options contracts and/or the duration of those contracts) would accelerate.

Back in March 2011, the CBOE helped to usher in the atomic volatility era when they rolled out volatility indices using the VIX methodology for six sector and geography ETFs:

  • iShares MSCI Emerging Markets Index Fund (VXEEM)
  • iShares Trust FTSE China 25 Index Fund  (VXFXI)
  • iShares MSCI Brazil Index Fund  (VXEWZ)
  • Market Vectors Gold Miners Fund (VXGDX)
  • iShares Silver Trust (VXSLV)
  • Energy Select Sector SPDR (VXXLE)

Later in March, the CBOE rolled out futures based on the gold volatility index (GVZ), which was launched back in August 2008, at the same time as the euro volatility index (EVZ) and several weeks after the launch of the OVX, known affectionately as “the Oil VIX.” [Those who are interested in the sequencing of the launch of various volatility measures should refer to The Evolution of the Volatility Index Family Tree.]

Now the CBOE is taking the next step with VXEEM, the volatility index that is based on the popular emerging markets ETF (EEM), and offering futures on that index. The launch of these futures contracts is set for January 9th and will initially include contracts with expirations in February, March, April and May. Note that the expiration cycles for these contracts are the same as those for the VIX futures and options, meaning that they will expire on Wednesdays (February 15, March 21, April 18 and May 16) and can last be traded on the Tuesday immediately following the expiration. For more information, check out the CBOE’s VXEEM splash page and information circular.

One of the reasons I think products based on EEM and VXEEM have a good chance of being successful is that emerging markets are typically a highly volatile area – much more so than the basket of stocks included in the S&P 500 index on which the VIX is based. Right now, for instance, EEM has a 60-day historical volatility that is more than 50% higher than that of the SPX. All this means that short-term traders should find VXEEM products (futures as well as options and ETPs, assuming they are in the pipeline) to be the types of high-octane trading vehicles that are well-suited to some of their favorite strategies, much like leveraged ETPs and VIX-based products.

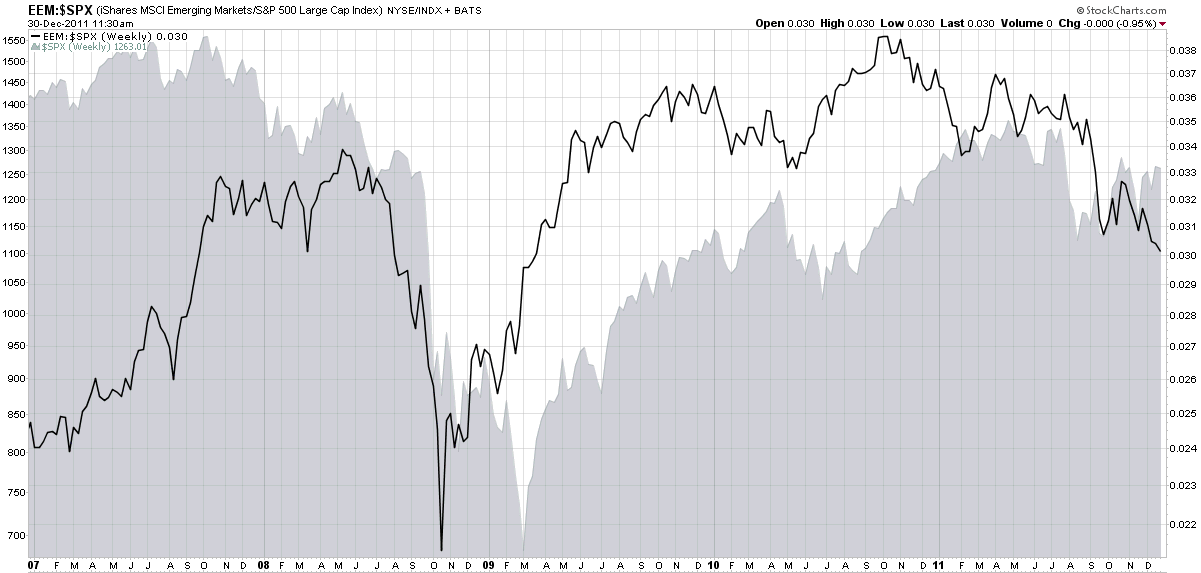
Additionally, as the chart below reminds us, emerging markets sometimes move in cycles that are distinct from U.S. stocks. Note that the ratio of EEM to SPX has varied wildly over the course of the past five years and has had different bottoms and tops than the SPX has. Whether this phenomenon will continue into the future (influenced strongly by China) remains to be seen, but the role of emerging markets relative to developed markets should be watched closely in 2012.

Related posts:

[source(s): StockCharts.com]

Disclosure(s): none

Wednesday, November 24, 2010

More Turkey Anyone?

It is the last week in November, so naturally all our thoughts are turning to the BCS and Turkey (TUR). Here I mean not Barclays and the bird, but the Bowl Championship Series possibilities and the emerging market.

As the chart below shows, anyone who has focused on Turkey not just as a seasonal play but a long-term holding has been nicely rewarded over the course of the past year, as Turkey has outperformed broader emerging markets ETFs like EEM by 5x. As captured in the chart, over the past month or so the performance advantage of TUR has begun to narrow. This could mean it is time to take profits and it could also spur the enterprising investor to go back for a second helping. Either way, I suggest that as 2011 approaches, investors make sure to look at emerging markets at least as a portfolio side dish, if not at a main course.

Related posts:


[source: ETFreplay.com]

Disclosure(s): long TUR at time of writing

Sunday, August 29, 2010

Chart of the Week: Irrepressible Colombia (GXG)

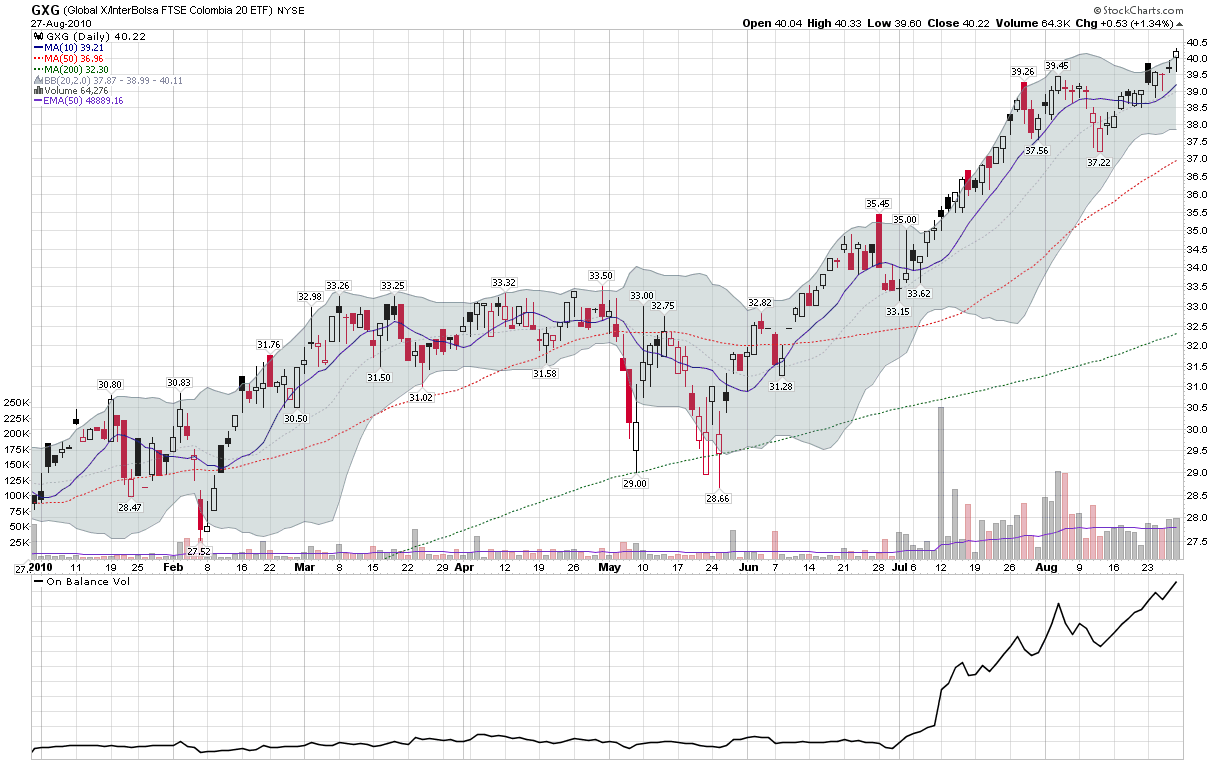
While U.S. investors can be forgiven for thinking that stocks have been stuck in a fairly narrow trading range for the last 3 ½ months, those who are scanning the globe for investment ideas are likely to have seen an entirely different investment climate.

A case in point is the Global X/InterBolsa FTSE Colombia 20 ETF (GXG), which has regularly been showing up as one of the top geography-based ETFs in my weekly newsletter. GXG is up 42% in 2010, handily outdistancing the BRIC ETF, EEB, and the popular broad-based emerging markets ETF, EEM, which are down -4.8% and -1.8% year-to-date, respectively.

Whereas BRIC has been a popular emerging markets investment theme for the past few years due to the popularity of Brazil (EWZ), Russia (RSX), India (EPI) and China (FXI), some have suggested that the current decade may turn out to be the decade of so-called frontier ETFs, with countries like Colombia, Indonesia (IDX), Vietnam (VNM), Egypt (EGPT), Turkey (TUR) and South Africa (EZA) among the top performers. These frontier ETFs already have their own catchy acronym, CIVETS, in order to make them easier to recall.

In terms of economic firepower, don’t expect the CIVETS to displace the BRIC countries, but when it comes to returns, the CIVETS are already off and running. With the best performance of any country ETF so far in 2010, Colombia has been acting like the new lead dog and has earned the spotlight as this week’s chart of the week.

Related posts:


[source: StockCharts.com]

Disclosure(s): long GXG, IDX and VNM at time of writing

Wednesday, February 3, 2010

Fidelity Offering 25 iShares ETFs Commission Free

Mutual fund giant Fidelity has largely sidestepped the ETF revolution, but the company fired in important competitive salvo when they announced that starting today 25 iShares ETFs will be available for trading through Fidelity on a commission-free basis.

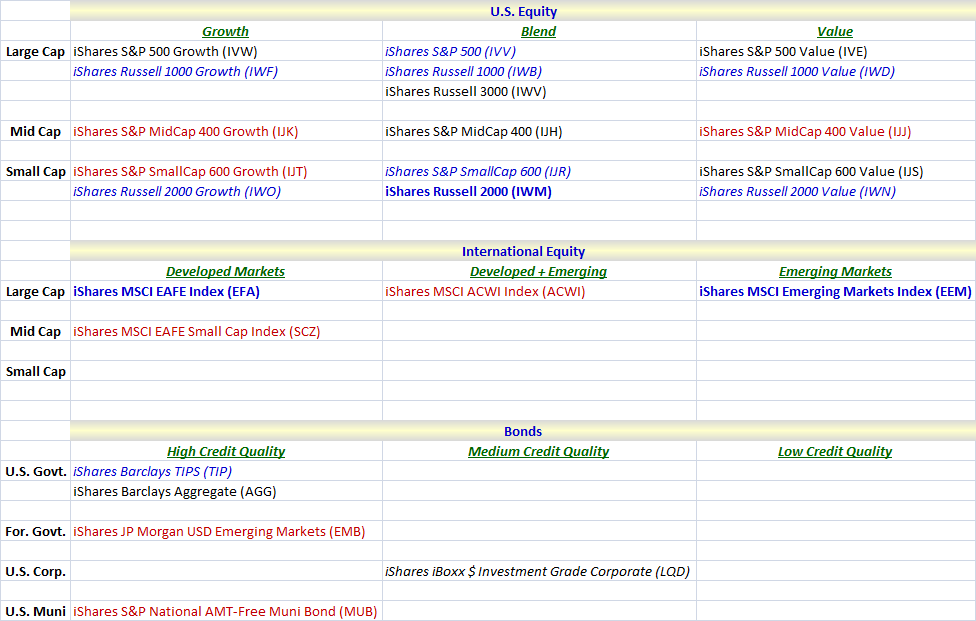
The 25 ETFs include 16 U.S. equity index ETFs, 4 ETFs based on international equity indices and 5 bond ETFs that cover a broad range of issuers, geographies and credit quality. The table below attempts to slice and dice these commission-free ETFs in a an way that should help investors who are unaware of some or all of these ETFs better understand their characteristics.

Included in the Fidelity/iShares 25 are three heavyweights that I have highlighted on bold blue font. Each of these ETFs trades 20 million shares or more per day on average and has a highly liquid options market. In fact, EEM and IWM are among the top five most actively traded ETFs. In addition to these three heavyweights, I have also highlighted in italicized blue font the eight other ETFs in this group which trade an average of at least 1 million shares per day. The next most liquid ETFs are in black font. Finally, I have reserved the red font for the seven ETFs that do not have options associated with them. Not surprisingly, the underlying ETFs are also among the least liquid of the group.

In terms of groupings, I have divided the ETFs into three high level categories: U.S. equity; international equity; and bonds categories. For the U.S. equity ETFs, I have further subdivided these ETFs into Morningstar style box categories. For international equity ETFs, I decompose these according to market cap and developed/emerging market exposure. Finally, for bond ETFs, these are broken down by issuer and credit quality.

Investors who have shied away from transaction-intensive strategies because of commission costs may now want to rethink some of those ideas in the context of the Fidelity/iShares commission-free ETFs. As for options traders, some stock-option strategies such as buy-writes now may deserve another look as well.

For related posts on these subjects, readers are encouraged to check out:


Disclosures: none

Sunday, May 31, 2009

Chart of the Week: Emerging Markets

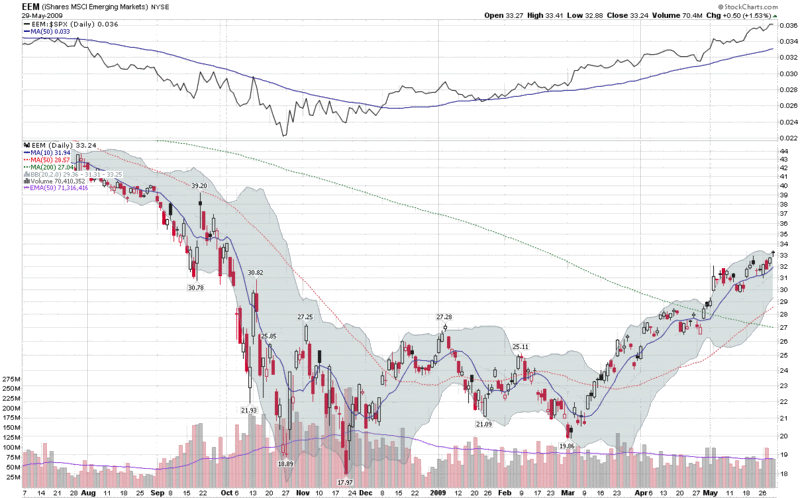
One of my best trades for 2009 has been a long position in EEM, the emerging markets ETF. The chart of the week below shows that emerging markets have been consistently outperforming the S&P 500 index since the beginning or January (see ratio study at top of chart) and was one of the first major equity groups to top its 200 day simple moving average (dotted green line) in late April. While the SPX has been going sideways during May, emerging markets have continued to tack on gains, bolstered by rising prices for commodities.

I would not be surprised to see EEM finding increasing resistance at several stages in the 34-40 range, but for now at least, I see no reason to exit EEM at least until its performance relative to the SPX begins to falter.


Disclosure: Long EEM at time of writing.

Friday, April 24, 2009

XLY and XHB Move Above 200 Day Moving Averages

Two important ETFs, XLY (consumer discretionary) and XHB (homebuilders) have moved above their 200 day simple moving averages today for the first time since early October.

Among other important indices and ETFs that are closing in on their 200 day SMAs are the NASDAQ-100 index (NDX), semiconductor index (SOX) and emerging markets ETF (EEM).

If the current bullishness holds, we may see widespread moves above the 200 day SMA – and the possibility of renewed buying interest…or an opportunity to take profits.

I am cautious as the SPX approaches 875, but am not interested in a substantial short position until there is some sort of bearish momentum.

Tuesday, January 6, 2009

Market Rewind on Risk

Since Joe Nocera, Michael Lewis and David Einhorn all had a chance to talk about risk in yesterday’s Required Reading segment, I thought it was timely of Jeff Pietsch at Market Rewind to pick this morning to offer up some of his thoughts on the subject of risk.

In ETF Risk in Review, Pietsch draws on data from his ETF Rewind tool to tackle the subject of risk-adjusted performance and ranks the 2008 performance of various ETFs within their grouping according to a Sortino Ratio (similar to the more familiar Sharpe Ratio, but the Sortino Ratio not penalize performance for upside volatility.) Not surprisingly, consumer staples (XLP) and health care (XLV) turn in the some of the best risk-adjusted performance numbers for 2008, while financials (XLF), emerging markets (EEM) and real estate (IYR) are notable laggards.

One key take away from the analysis is the value of thinking of ETFs in terms of miniature portfolios whose performance can be evaluated on a risk-adjusted basis. We witnessed history in 2008 and as painful as some of that history may have been to live through, hopefully we all enter 2009 with the benefit of a healthier and more sophisticated perspective on volatility and risk.

Tuesday, December 9, 2008

BRIC Update: China a Leader or Outlier?

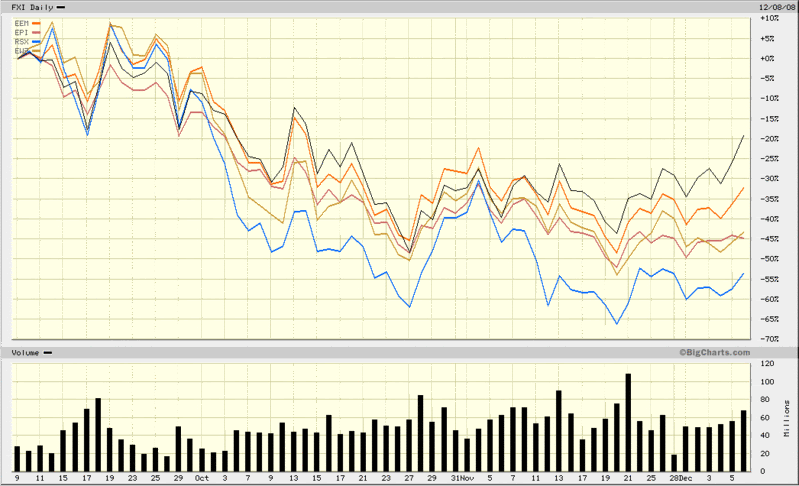
I have commented on resurgent Chinese stocks several times in the past few weeks, most recently in China About to Break Out? Now that Chinese stocks (FXI, black line) appear to be on the rebound, an important question is whether this is an isolated phenomenon or one that will also affect other emerging markets economies.

As the chart below shows, the rally in Chinese stocks has significantly outdistanced the recent bounce in emerging market stocks (EEM, orange line). It is the other three members of the BRIC group, however, that are lagging China and the broad emerging markets group the most. Not surprisingly, commodity-rich Russia (RSX, blue line) is the biggest laggard among the BRIC countries, while India (EPI) and Brazil (EWZ) are trailing the broader emerging markets index, but performing better than Russia.

The question of whether growing domestic demand and a massive government stimulus package will result in a China-specific rebound or help pull other global economies along for the ride is not likely to be answered soon. In the meantime, China looks strong on a relative basis and other emerging economies should be watched closely for clues about the geographical breadth of the rally.

[source: BigCharts]

Tuesday, February 26, 2008

Brazil Rallies While China Struggles

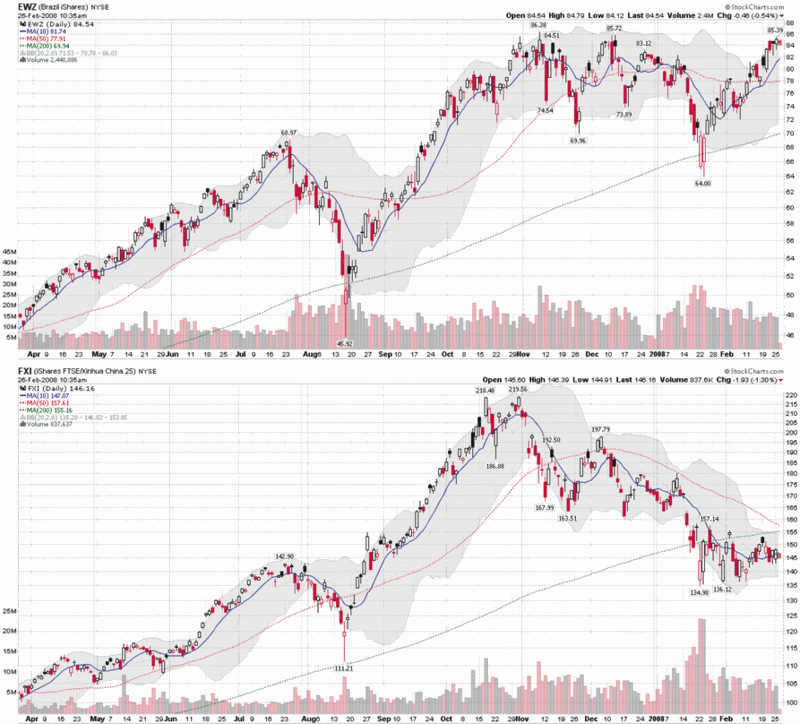
As the chart below shows, speculative money has been cautious about China since late October, but still bullish on Brazil, as indicated by the strong performance in EWZ, the iShares MSCI Brazil Index ETF. Not only is EWZ showing a gain for the year, but in an impressive display of strength, it has rallied more than 30% off of the January low. This performance puts EWZ not only well ahead of the most popular Chinese ETF, FXI, but also considerably ahead of the broad market emerging market ETF, EEM, known formally as the iShares MSCI Emerging Markets Index.

While EWZ is a great way to play the Brazilian market, there are several ADRs that are worth singling out as well. My Portfolio A1 holds Tele Norte Leste Participacoes SA (TNE) and has also been long Brasil Telecom Participacoes SA (BRP) in recent months, but there are even better plays. In fact, of the handful of long-term global holdings that I believe you could almost buy and forget about, two of my favorites are Brazilian giants. At the top of the list is Petroleo Brasileiro SA (PBR), a.k.a. Petrobras, the superbly managed national oil company that is pushing the envelope in the ultra-deep recovery space with their massive Tupi oilfield. Close behind is Vale (RIO), formerly know as Companhia Vale do Rio Doce, the metals and mining giant that recently extracted a 65% price increase in iron ore prices from Baosteel, the largest steel company in China.

In a healthy global economy, PBR and RIO are two of the best blue chip oil and iron plays out there. For those wishing a broader, more diversified play, EWZ is hard to beat, especially as Brazil continues to outpace China.

Tuesday, September 4, 2007

The Emerging Markets Engine

As I write this, the EEM is about 6% off of its 52 week high, but even this number dramatically understates the staying power of this emerging markets ETF.

A better way to think about the strength of the EEM is to look at its performance relative to that of the EFA, a capitalization-weighted ETF that necessarily tilts strongly in the direction of the most developed countries in Europe, Australasia and the Far East, as the fund’s holdings confirm.

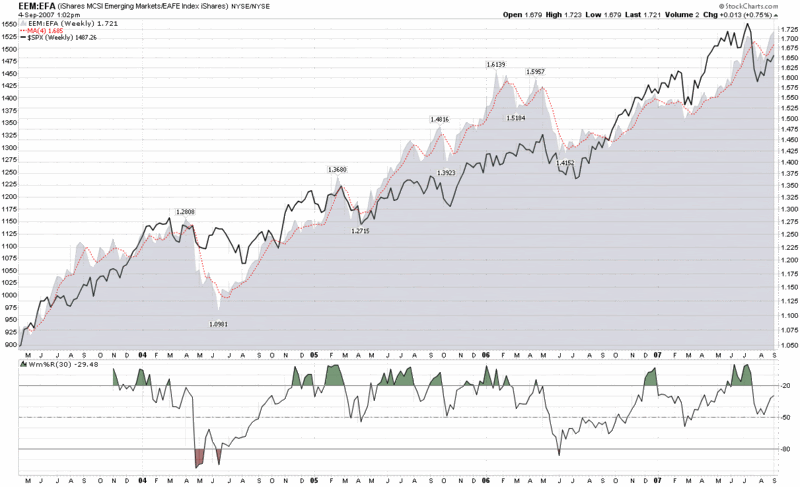
Looking at a ratio chart of the EEM to the EFA, you can see that over the course of the past 4 ½ years, returns in emerging markets have consistently outstripped those of the EFA, save for two brief periods in the summer of 2004 and the summer of 2006. What I find particularly interesting is that the normally skittish emerging markets barely flinched (note the Williams %R) during the corrections that hit the SPX in February and July of this year. Not only were the dips in emerging markets brief, but the recovery in these markets was much stronger and faster than it was in the SPX or the EFA, as anyone who has watched the Chinese markets and the FXI ETF in particular can attest to.

Other ratios of speculative activity, such as the capitalization ratios of the RUT:OEX or RUT:SPX, reflect some of the battle scars of the last few months. Speculative activity in emerging markets, however, continues to show healthy investment in that sector. Whether speculation in emerging markets is in fact too healthy may become an issue in the coming year, but for now I am content to conclude that a powerful emerging markets engine is a positive signal for the global economy.

Friday, August 17, 2007

How Healthy Is the Rally?

I don't have much to add to what has already been said about today's rally.

For what it's worth I am watching three indicators in particular to gauge the health and longer term potential of this rally:
XBD -- broker/dealer index (to a lesser extent XBD:SPX, GS, BSC, BKX, CFC, etc.)
RUT -- Reuters 2000 Small Cap Index (also RUT:SPX)
EEM -- iShares MSCI Emerging Markets (also EEM:EFA)

Right now, all three indicators are outperforming the broad market indices, so I feel as if the rally is on good footing. My biggest concern coming into the day was that would be traders worried about Monday's headline risk, but the longer the indicators noted above continue to do well, the less pressure there will be on the system.

For a little while earlier in the day the markets and the VIX were both up, as fear lingered in the face of a weekend of uncertainty, but for now, the fear component of the VIX seems to be slowly dissipating.

Before I finalize my positions going into the weekend, I will take one last look at Hurricane Dean.

Thursday, May 24, 2007

A Global Indicator to Watch

One of the best features of StockCharts.com is that it allows you to keep track of ratios for just about any security you can think of. With the continued expansion of the reach of ETFs (monitored by Tom Lydon at ETFtrends.com, among others), the possibilities are growing rapidly, limited more by the lack of historical data for newly minted ETFs than anything else.

With all the talk of a Chinese bubble, there is no better time than the present to have one or more good global sentiment indicators so you can get a handle on whether you should be worried about the extent of speculative activity in Mexico, Malaysia, Brazil and perhaps China or whether you might be better off following the trends.

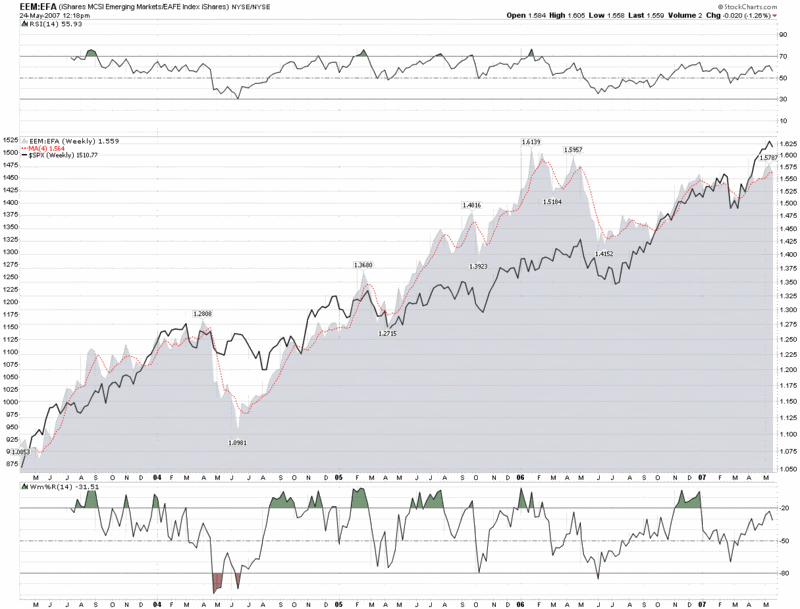
One ratio I have been looking at is that of emerging markets to developed markets. Two highly liquid ETFs that track these markets nicely are the iShares MSCI Emerging Markets Index (EEM) and the iShares MSCI EAFE Index Fund (EFA), where EAFE refers to Europe, Australasia and the Far East. Each ETF is capitalization-weighted and you can get a sense of the differences in their holdings by looking at the iShares complete holdings list for EEM and EFA.

Since EEM first traded in April 2003 and EFA goes back to August 2001, our ratio chart is able to provide four years of combined data, which is a long time in ETF years.

In the chart below, the relative spikes in emerging markets generally provide an indication when speculative activity is getting out of hand and often provide advance warning for an upcoming drop in the SPX. I will leave it to readers to determine whether or not the extent of the correlation is worth tracking going forward. I am certainly going to keep an eye on it.

DISCLAIMER: "VIX®" is a trademark of Chicago Board Options Exchange, Incorporated. Chicago Board Options Exchange, Incorporated is not affiliated with this website or this website's owner's or operators. CBOE assumes no responsibility for the accuracy or completeness or any other aspect of any content posted on this website by its operator or any third party. All content on this site is provided for informational and entertainment purposes only and is not intended as advice to buy or sell any securities. Stocks are difficult to trade; options are even harder. When it comes to VIX derivatives, don't fall into the trap of thinking that just because you can ride a horse, you can ride an alligator. Please do your own homework and accept full responsibility for any investment decisions you make. No content on this site can be used for commercial purposes without the prior written permission of the author. Copyright © 2007-2023 Bill Luby. All rights reserved.
 
Web Analytics