Showing posts with label EPI. Show all posts

Thursday, August 29, 2013

Watching Two Key Emerging Markets Currencies

With Syria and the Fed grabbing most of the headlines in the last few days, I wonder how many people have emerging markets currencies at the top of their list of concerns. I am guessing few are poring over the likes of India (EPI), Indonesia (EIDO), Brazil (EWZ), Turkey (TUR), South Africa (EZA), Thailand (THD) and the Philippines (EPHE) on a daily basis. As a matter of fact, I would bet that very few people even know that there is an ETF dedicated to the Philippines.

While keeping an eye on country-specific equities is important, it is currency movements that are at the heart of the emerging markets problem right now. Of course, the issue with currencies is really little more than a downstream effect of rising interest rates in the U.S., which is a result of changing expectations about the Fed’s quantitative easing (QE) program. Since December 2008, the Fed has used a variety of policy instruments to keep interest rates as low as possible in the U.S. and has effectively driven capital to emerging markets, where higher-yield investments looked more attractive. As QE begins to unwind, the supply of easy money in emerging markets has suddenly come to a halt and countries with large current account deficits and loans denominated in dollars (which will be repaid in a local currency that is rapidly declining in value) are particularly vulnerable.

Since many equity investors do not have access to a full menu of currency crosses, I think it is important to note that there are ETPs that track two of the most important emerging markets currencies:

  • WisdomTree Indian Rupee ETF (ICN)
  • WisdomTree Brazilian Real ETF (BZF)

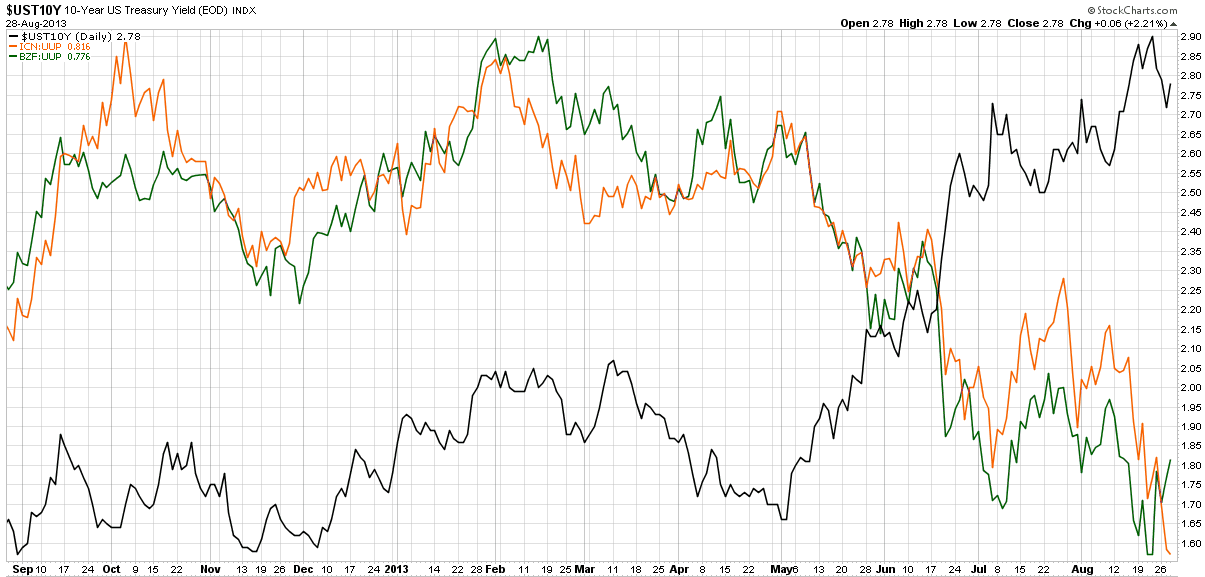
In the chart below I show the yield in the 10-Year U.S. Treasury Note (UST10Y) in the black line, along with a ratio of the Indian Rupee to the U.S. dollar (ICN:UUP) in orange, as well as a ratio of the Brazilian Real to the dollar (BZF:UUP) in green. Now these are a roll-your-own ratio of ETFs to ETFs rather than the exact currency crosses, but the charts are almost identical (and easily constructed at StockCharts.com), while the key takeaways are necessarily the same. Note that until May, ICN and BZF relative to the dollar appeared to be more positively correlated to U.S. interest rates than negatively correlated. As soon as interest rates began to rise at the beginning of May, both ICN and BZF began to rapidly lose ground against the dollar and the negative correlation with U.S. interest rates suddenly became very strong.

One last point worth noting is that the BZF:UUP ratio has seen a bounce during the course of the last week, while the ICN:UUP ratio continues to deteriorate, as there has been little to suggest that the Indian Rupee is stabilizing, even as Brazil improves somewhat.
[source(s): StockCharts.com]

For those who are interested in evaluating the risk and uncertainty in emerging markets in general, the recent VEXXM as a Measure of Emerging Markets Volatility and Risk is recommended reading for some background and information on VXEEM, the CBOE Emerging Markets ETF Volatility Index.

Related posts:

Disclosure(s): long EWZ at time of writing

Tuesday, July 2, 2013

Charting the Recent Decline of the BRIC Components

U.S. stocks are mostly green in today’s session, though there is a good deal of red in global stocks, notably in emerging markets, where the popular EEM emerging markets ETF is down close to 1% as I type this and the Brazil (EWZ) is down more than 2%.

In the chart below, I plot the recent decline of the four large BRIC emerging market country ETFs: Brazil (EWZ); Russia (RSX); India (EPI); China (FXI). While all four country ETFs have declined between 8% and 20% during the past six weeks, the various woes afflicting each country appear to be country-specific to a large extent, though obviously the issues affecting China’s manufacturing base and export market have a significant upstream impact on Brazil.

Emerging markets in general have been struggling as of late, but difficulties in Brazil, India and China have helped to fuel a global selloff.

Going forward, investors will be well-served to keep an eye on all four components of the BRIC block, as well as aggregated BRIC ETFs, such as the most popular issue in this space: the iShares MSCI BRIC Index (BKF).

For those who are interested in evaluating the risk and uncertainty in emerging markets in general, the recent VEXXM as a Measure of Emerging Markets Volatility and Risk is recommended reading for some background and information on VXEEM, the CBOE Emerging Markets ETF Volatility Index.

[source(s): StockCharts.com]

Related posts:

Disclosure(s): long EEM at time of writing

Thursday, June 20, 2013

VXEEM as a Measure of Emerging Markets Volatility and Risk

If you think U.S. stocks have been through a rough patch as of late, then you haven’t been paying attention to emerging markets stocks, where the popular EEM emerging markets ETF as fallen from a high of 42.96 on May 22nd to 37.02 earlier today – a 13.8% drop in less than one month. A large part of the problem has been the performance of the BRIC countries, where Brazil (EWZ), China (FXI) and India (EPI) are all acting as if they have been thrown overboard with anchors tied to their ankles, making Russia (RSX) look like the most stable investment of the group – which is quite a task.

Investors looking to monitor risk and uncertainty in Brazil and China are fortunate enough to have dedicated volatility indices based on the VIX methodology for EWZ and FXI. These volatility indices were created by the CBOE and use the tickers VXEWZ and VXFXI, respectively. For a more holistic view of risk and uncertainty in the emerging markets space, the best choice is probably VXEEM, the CBOE Emerging Markets ETF Volatility Index that is calculated based on options in EEM.

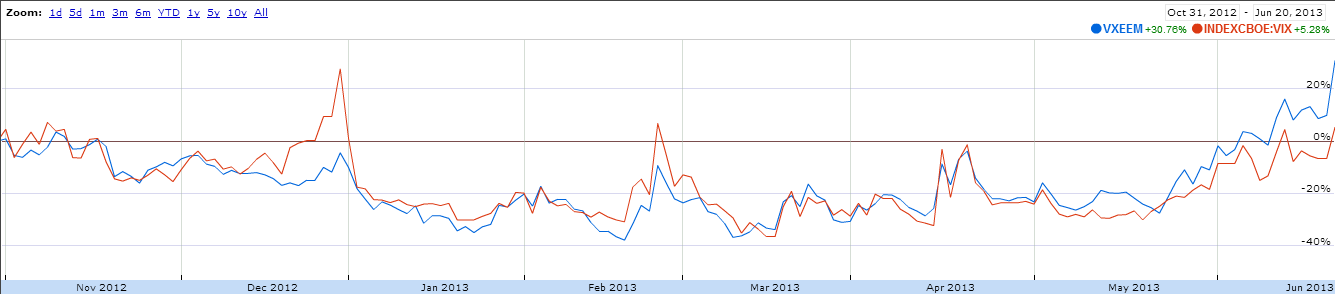
The chart below shows the relative performance of VXEEM and the VIX going back to the end of October 2012. Note that during toward the end of 2012, the debate over sequestration caused the markets to assign much more additional risk and uncertainty to U.S. stocks than to emerging markets stocks. During the course of the last month or two, this relationship has reversed and the risk and uncertainty associated with VXEEM has grown at a much faster rate than that of the VIX. On average, the absolute level of VXEEM is about 40% higher than that of the VIX. This week, however, VXEEM has been about 60% higher than the VIX.

On a related note, I find it interesting that S&P announced the launch of the S&P Emerging Markets Volatility Short-Term Futures Index just ten days ago. With that index in place, it would be relatively easy to create a futures-based emerging markets volatility ETP that would function in the same manner as VXX, but be based on VXEEM rather than the VIX. The biggest obstacle to this type of product is probably the current lack of liquidity in the VXEEM futures market.

[source(s): Google Finance]

Related posts:

Disclosure(s): short VXX at time of writing

Sunday, August 29, 2010

Chart of the Week: Irrepressible Colombia (GXG)

While U.S. investors can be forgiven for thinking that stocks have been stuck in a fairly narrow trading range for the last 3 ½ months, those who are scanning the globe for investment ideas are likely to have seen an entirely different investment climate.

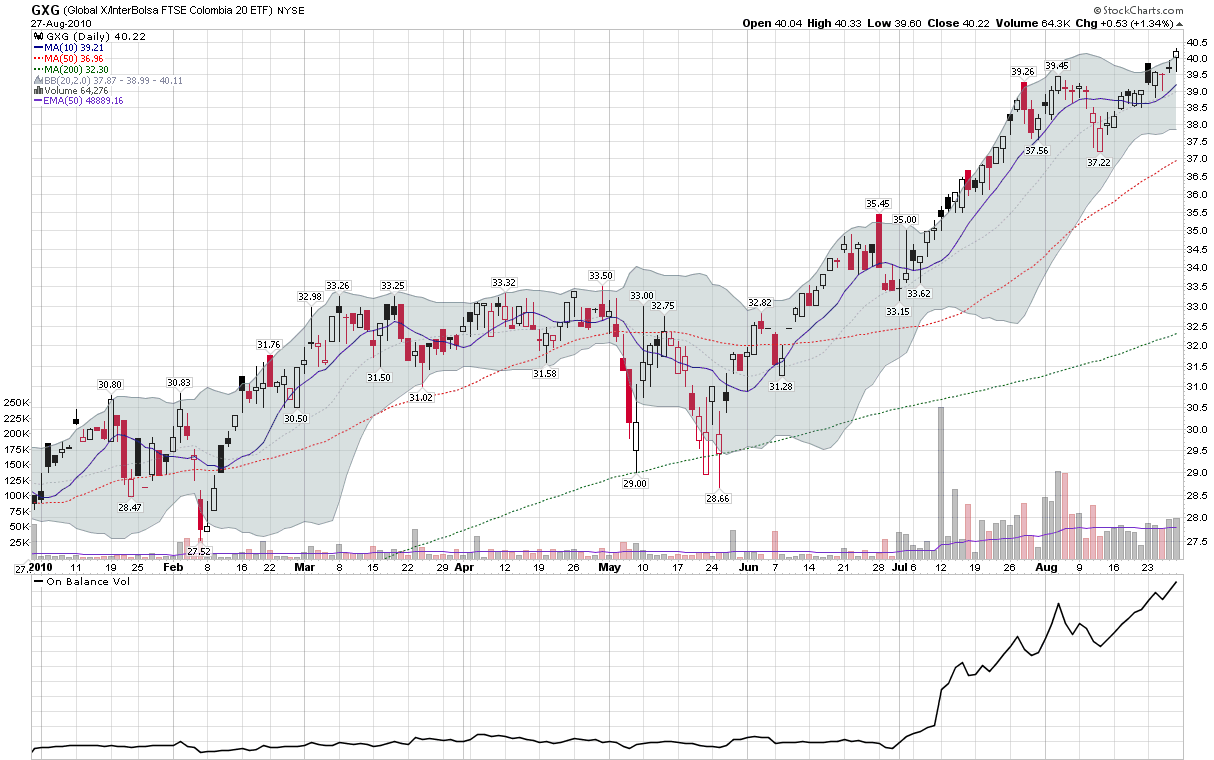
A case in point is the Global X/InterBolsa FTSE Colombia 20 ETF (GXG), which has regularly been showing up as one of the top geography-based ETFs in my weekly newsletter. GXG is up 42% in 2010, handily outdistancing the BRIC ETF, EEB, and the popular broad-based emerging markets ETF, EEM, which are down -4.8% and -1.8% year-to-date, respectively.

Whereas BRIC has been a popular emerging markets investment theme for the past few years due to the popularity of Brazil (EWZ), Russia (RSX), India (EPI) and China (FXI), some have suggested that the current decade may turn out to be the decade of so-called frontier ETFs, with countries like Colombia, Indonesia (IDX), Vietnam (VNM), Egypt (EGPT), Turkey (TUR) and South Africa (EZA) among the top performers. These frontier ETFs already have their own catchy acronym, CIVETS, in order to make them easier to recall.

In terms of economic firepower, don’t expect the CIVETS to displace the BRIC countries, but when it comes to returns, the CIVETS are already off and running. With the best performance of any country ETF so far in 2010, Colombia has been acting like the new lead dog and has earned the spotlight as this week’s chart of the week.

Related posts:


[source: StockCharts.com]

Disclosure(s): long GXG, IDX and VNM at time of writing

Monday, December 14, 2009

The BRIC Bull

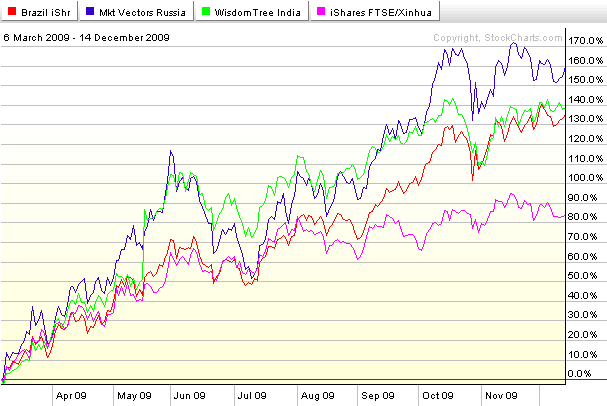
The last time I wrote about the relative performance of the BRIC countries was a little over eight months ago, in Russia Leading the BRIC Rally. At that time, the bounce off of the March lows was barely a month old and Russia (RSX) was leading the way, followed closely by India (EPI), with Brazil (EWZ) and China (FXI) not rallying quite as sharply.

Fast forward eight months and Russia is still out in front, but starting to look a little tired. For all the talk of a Chinese bubble, FXI, the most popular Chinese ETF, is a distant fourth and falling farther behind the other BRIC ETFs with each passing week. Since the end of October, the top performers have been India and Brazil. In fact the top India ETF (EPI) is now 21% higher than it was the day before the Lehman Brothers bankruptcy, while the Brazil ETF is 29% higher than its was trading just before the Lehman debacle.

Looking ahead to 2010, I expect Russia will have considerable difficulty remaining the top performer. I would not be surprised to see Brazil eclipse the bunch, followed by India and a resurgent China. One thing is certain: if investors can predict the plight of the BRIC ETFs in 2010, quite a few of the other pieces of the investment puzzle will magically begin fall into place.

For more on related subjects, readers are encouraged to check out:

[source: StockCharts]

Disclosure: none

Saturday, April 11, 2009

Russia Leading the BRIC Rally

The last time I checked in with the BRIC countries, four months ago, the issue de jour was BRIC Update: China a Leader or an Outlier? At that time, China was starting to move impressively off of an October bottom and Russia was a notable laggard.

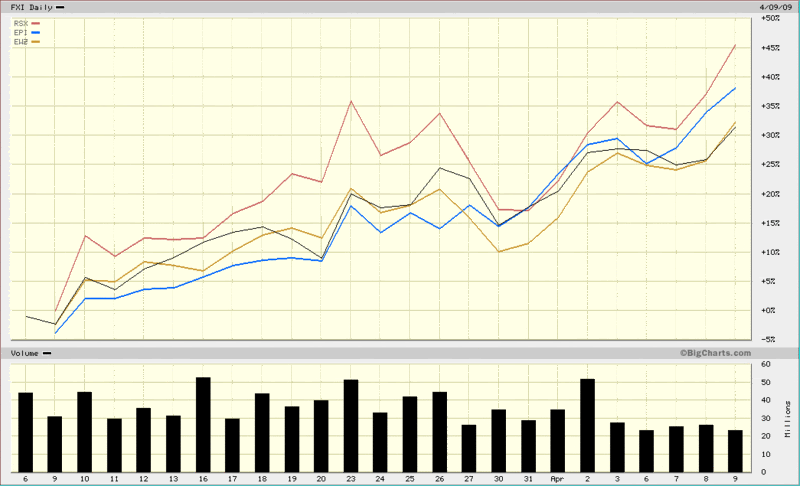
As the chart below shows, in the five weeks since the U.S. stock indices have bottomed, it is Russia (RSX, red line) that has been the strongest performer, followed by India (EPI, blue line), with Brazil (EWZ, gold line) and China (FXI, black line) bringing up the rear.

I watch these relationships closely for a number of reasons, not the least of which is to determine how well the group as a whole is performing, if any particular country is separating itself from the pack, whether commodity producers or consumers are in favor, etc.

Part of the reason Russia has bounced more than its BRIC counterparts is that Russia suffered disproportionately in the recent bear market. In the nine months from June 2008 to February 2009, the RSX Russian ETF lost more than 82% of its value. The last month, however, has seen some notable improvements. Russia’s credit default swaps, for instance, which reflect to the cost to insure the country’s debt, have improved from 694 to 412 in the last four weeks as the outlook for that country’s sovereign debt has improved dramatically.

Going forward, country-specific trends may continue to dominate, but I suspect the relative performance of Russia and Brazil will say more about improvements in the commodities market as a whole than about the plight of a particular national economy.

[source: BigCharts]

Tuesday, December 9, 2008

BRIC Update: China a Leader or Outlier?

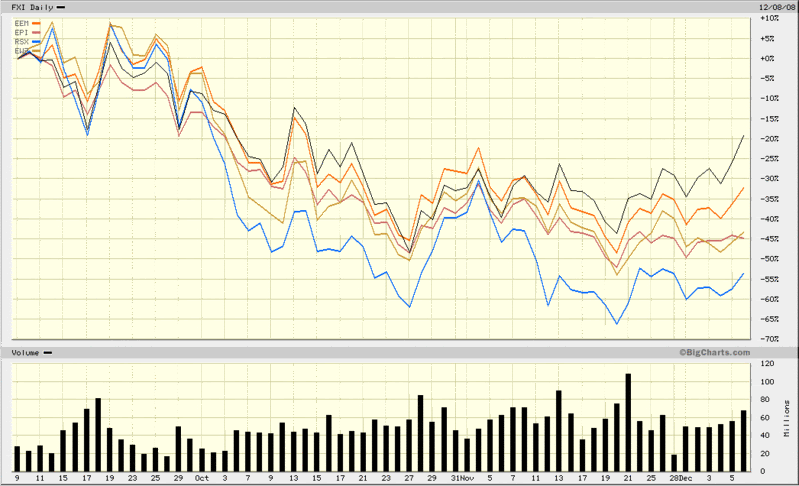
I have commented on resurgent Chinese stocks several times in the past few weeks, most recently in China About to Break Out? Now that Chinese stocks (FXI, black line) appear to be on the rebound, an important question is whether this is an isolated phenomenon or one that will also affect other emerging markets economies.

As the chart below shows, the rally in Chinese stocks has significantly outdistanced the recent bounce in emerging market stocks (EEM, orange line). It is the other three members of the BRIC group, however, that are lagging China and the broad emerging markets group the most. Not surprisingly, commodity-rich Russia (RSX, blue line) is the biggest laggard among the BRIC countries, while India (EPI) and Brazil (EWZ) are trailing the broader emerging markets index, but performing better than Russia.

The question of whether growing domestic demand and a massive government stimulus package will result in a China-specific rebound or help pull other global economies along for the ride is not likely to be answered soon. In the meantime, China looks strong on a relative basis and other emerging economies should be watched closely for clues about the geographical breadth of the rally.

[source: BigCharts]

DISCLAIMER: "VIX®" is a trademark of Chicago Board Options Exchange, Incorporated. Chicago Board Options Exchange, Incorporated is not affiliated with this website or this website's owner's or operators. CBOE assumes no responsibility for the accuracy or completeness or any other aspect of any content posted on this website by its operator or any third party. All content on this site is provided for informational and entertainment purposes only and is not intended as advice to buy or sell any securities. Stocks are difficult to trade; options are even harder. When it comes to VIX derivatives, don't fall into the trap of thinking that just because you can ride a horse, you can ride an alligator. Please do your own homework and accept full responsibility for any investment decisions you make. No content on this site can be used for commercial purposes without the prior written permission of the author. Copyright © 2007-2023 Bill Luby. All rights reserved.
 
Web Analytics