Showing posts with label Brazil. Show all posts

Saturday, December 31, 2016

The Year in VIX and Volatility (2016)

The consensus called for a big uptick in volatility in 2016 and while there was a lot of drama, the VIX spikes were relatively manageable and short-lived.  The VIX opened the year at 22.48 and ended the year at just 14.04.  For the full year, the median VIX was 14.31, while SPX historical volatility for the full year ended up at a mere 13.12.

That being said, there were five distinct VIX spikes in the graphic below, listed according to chronology:
  • Fears related to slowing growth in China (January)
  • A plunge in crude oil prices to $26.05/bbl. for WTIC, as investors grappled with the possibility that Cushing storage facilities would be exhausted (February)
  • The surprise Brexit vote result in favor of the U.K. leaving the E.U. (June)
  • A cocktail of nearly simultaneous shocks from Fed President Rosengren (suddenly sounding hawkish), Jeff Gundlach (interest rates have bottomed) and the European Central Bank (no additional stimulus) puts pressure on stocks (September)
  • Increasing uncertainty leading up to the U.S. election (November) 

In all five instances, the VIX moved up sharply, but in defiance of historical precedent, the volatility index moved down almost as sharply as it moved up.  In fact, some of the biggest extremes for the year came in the form of volatility crushes, where the VIX had an unprecedented series of sharp downward one-day move.  Checking the record books, the only previous year that the VIX posted three top 20 one-day declines was 2007 – and clearly investors were in denial that year.  This year the Trump election caused the sixth largest one-day drop in the history of the VIX, whereas the Thursday before and Tuesday after the Brexit vote triggered the eighteenth and tenth largest one-day VIX declines.

On the other side of the ledger, some of the upward moves in the VIX made the record books as well.  The day following the Brexit vote saw a 49.3% VIX spike – the fifth highest one-day spike on record.  What was even more surprising was the Rosengren/Gundlach/ECB cocktail noted above triggered a 39.9% spike (eleventh highest in history) in what seemed to be a relatively calm market environment in September.  It turns out the VIX was just getting warmed up for greater things, including a record nine consecutive up days leading up to the November election.

Even with these extremes, the highs and lows in the VIX were rather middling, with the VIX peaking at 32.09 on January 20th and hitting an annual low of 10.93 on December 21st.

The graphic below captures these and other highlights from 2016:


[source(s): StockCharts.com, VIX and More]

Included in the non-VIX highlights are a 5000+ year low in interest rates in Europe and Japan (where negative interest rates prevailed) as well as a thirteen-year low in the price of crude oil.  On the geopolitical front, political craziness of one kind or another abounded in Brazil, South Korea, Turkey, Italy, Colombia and South Africa, among other locations.  Terrorism also left its footprint again in 2016 and Zika also created considerable political and social turmoil.  In the financial realm, European banks had a very difficult year and begin 2017 on shaky footing.

While the year ended on a relatively quiet not, I suspect 2017 will have much more in the way of new surprises, including swans of many dark hues.  Next week I will resume the VIX and More fear poll and find out what the consensus is for volatility and its causes in the coming year.

Finally, since 2011, I have been maintaining a proprietary Macro Risk Index that measures volatility and risk across a broad range of asset classes, including U.S. equities, foreign equities, commodities, currencies and bonds.  In 2016, the Macro Risk Index was trending down most of the year, punctuated by significant spikes in February (crude oil) and again in June (European currencies). 

How did 2016 measure up to expectations?  I sum up the year in My Low Volatility Prediction for 2016: Both Idiocy and Genius.  Also worth investigating are a pair of Barron’s articles from one year ago laying out two opposing perspectives on volatility in 2016.  For the case for rising volatility and what to do about it, try Jared Woodard’s Prepare for Rising Volatility in 2016.  I provide the contrarian point of view in The Case Against High Stock-Market Volatility in 2016.

Have a happy, healthy and profitable 2017!

Related posts:


For those who may be interested, you can always follow me on Twitter at @VIXandMore

Disclosure(s): the CBOE is an advertiser on VIX and More

Friday, December 30, 2016

My Low Volatility Prediction for 2016: Both Idiocy and Genius

A year ago, Steve Sears of Barron’s asked me to pen a guest column for The Striking Price and use the opportunity to opine on how I saw the volatility landscape unfolding in 2016.  Without thinking about it too much, I was fairly certain I was going to devote the column to the many threats that had the potential to spiral out of control during the course of the year, but before I had an opportunity to start translating my thoughts into writing, other pundits started weighing in with their predictions for 2016 and without exception, everyone who ventured a guess on the direction of volatility was adamant that volatility would be substantially higher in 2016 than 2015.

Not wanting to follow the herd and always on the lookout for a more provocative point of view, I decided to fade the consensus, rip up the script in my head and adopt a contrarian outlook:  The Case Against High Stock-Market Volatility in 2016.  The column began as follows:

“Looking at all the market predictions for 2016, one thing is certain: Almost all of the pundits agree that volatility will be up, making a bet on rising volatility one of the year’s most popular trading ideas.

But, as is the case with much of the investment landscape, when most of the pundits agree about how the future will unfold, it pays to investigate the contrarian point of view.

As to volatility, the contrarian perspective is particularly compelling for 2016 because volatility is notoriously hard to predict; investors have a habit of dramatically overestimating its future level; and, when it comes to forecasting the causes of volatility, “experts” and investors alike have a penchant for fighting the last war.”

Then came January.  For those who have tried to put it out of their memory, January was one of the worst first months on record, with the S&P 500 Index falling 7.3% for the month.  The bearish trend continued into February, as fears related to China and crude oil had investors selling en masse.  By the time stocks found a bottom on February 11th, the S&P 500 Index was down 11.4% -- by some measures the worst beginning for stocks in history.  Volatility, of course, was spiking and the VIX had already topped 30.00 on three separate occasions just seven weeks into the year.

My prediction of lower volatility:  complete idiocy.

But the year was not over and we still had to grapple with Brexit, the crazy and unpredictable election season in the U.S., a Fed interest rate hike and persistent political turmoil in places like Italy and Brazil.  Amazingly, stocks showed a tremendous amount of resiliency and all the VIX spikes were given the Whac-A-Mole treatment as VIX mean reversion emerged as a key theme during 2016.

Now that the year is (almost) in the books, it turns out my contrarian low volatility prediction was spot on and the rest of the pundits ended up on the wrong side of a crowded losing trade, assuming one was patient enough to take a full-year perspective.  Genius?  Probably not, but definitely more right than wrong, despite my having to wear a dunce cap for the first two months of the year.

The graphic below shows the annual average VIX and historical volatility going back to 1990.  Note that while the average VIX fell from 16.67 to 15.83 this year, there was an even larger drop in realized or historical volatility, which fell sharply from 15.53 to 13.14.

[source(s):  CBOE, Yahoo, VIX and More]

As far as takeaways are concerned, there is the obvious lesson regarding the herd mentality and crowded trades.  Additionally, there are also issues regarding how investors frame a problem or potential problem.  For example, when one expects an increase in volatility they are more likely to be overprepared for that development and/or overreact when there are initial signs of an increase in volatility.  Ironically, if investors load up on SPX puts or VIX calls, then this makes it much more difficult for panic to filter into the market.  This leads to a theme that has been repeated often in this space:  VIX spikes are notoriously difficult to predict and it is also more difficult to anticipate a change in volatility regimes than many believe.

Last but not least, as the graphic above shows, predictions of future volatility almost always overshoot realized volatility, which is why in the last 27 years only the extreme turmoil in 2008 saw realized volatility higher than the VIX over the course of a full year.

As for 2017, when it comes to volatility, expect the unexpected.

Related posts:


For those who may be interested, you can always follow me on Twitter at @VIXandMore

Disclosure(s): the CBOE is an advertiser on VIX and More

Tuesday, July 2, 2013

Charting the Recent Decline of the BRIC Components

U.S. stocks are mostly green in today’s session, though there is a good deal of red in global stocks, notably in emerging markets, where the popular EEM emerging markets ETF is down close to 1% as I type this and the Brazil (EWZ) is down more than 2%.

In the chart below, I plot the recent decline of the four large BRIC emerging market country ETFs: Brazil (EWZ); Russia (RSX); India (EPI); China (FXI). While all four country ETFs have declined between 8% and 20% during the past six weeks, the various woes afflicting each country appear to be country-specific to a large extent, though obviously the issues affecting China’s manufacturing base and export market have a significant upstream impact on Brazil.

Emerging markets in general have been struggling as of late, but difficulties in Brazil, India and China have helped to fuel a global selloff.

Going forward, investors will be well-served to keep an eye on all four components of the BRIC block, as well as aggregated BRIC ETFs, such as the most popular issue in this space: the iShares MSCI BRIC Index (BKF).

For those who are interested in evaluating the risk and uncertainty in emerging markets in general, the recent VEXXM as a Measure of Emerging Markets Volatility and Risk is recommended reading for some background and information on VXEEM, the CBOE Emerging Markets ETF Volatility Index.

[source(s): StockCharts.com]

Related posts:

Disclosure(s): long EEM at time of writing

Monday, December 14, 2009

The BRIC Bull

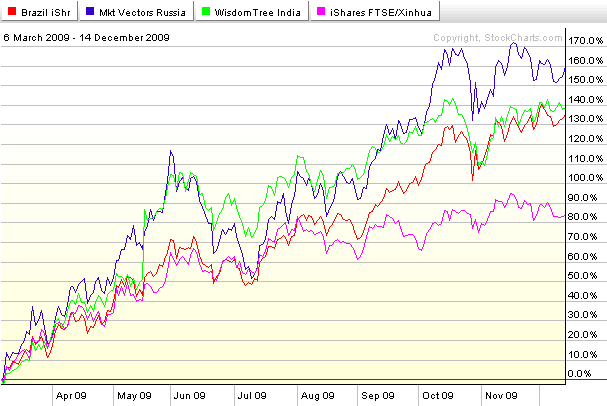
The last time I wrote about the relative performance of the BRIC countries was a little over eight months ago, in Russia Leading the BRIC Rally. At that time, the bounce off of the March lows was barely a month old and Russia (RSX) was leading the way, followed closely by India (EPI), with Brazil (EWZ) and China (FXI) not rallying quite as sharply.

Fast forward eight months and Russia is still out in front, but starting to look a little tired. For all the talk of a Chinese bubble, FXI, the most popular Chinese ETF, is a distant fourth and falling farther behind the other BRIC ETFs with each passing week. Since the end of October, the top performers have been India and Brazil. In fact the top India ETF (EPI) is now 21% higher than it was the day before the Lehman Brothers bankruptcy, while the Brazil ETF is 29% higher than its was trading just before the Lehman debacle.

Looking ahead to 2010, I expect Russia will have considerable difficulty remaining the top performer. I would not be surprised to see Brazil eclipse the bunch, followed by India and a resurgent China. One thing is certain: if investors can predict the plight of the BRIC ETFs in 2010, quite a few of the other pieces of the investment puzzle will magically begin fall into place.

For more on related subjects, readers are encouraged to check out:

[source: StockCharts]

Disclosure: none

Wednesday, October 15, 2008

Implied Volatility Over 150 in EWZ, the Brazil ETF

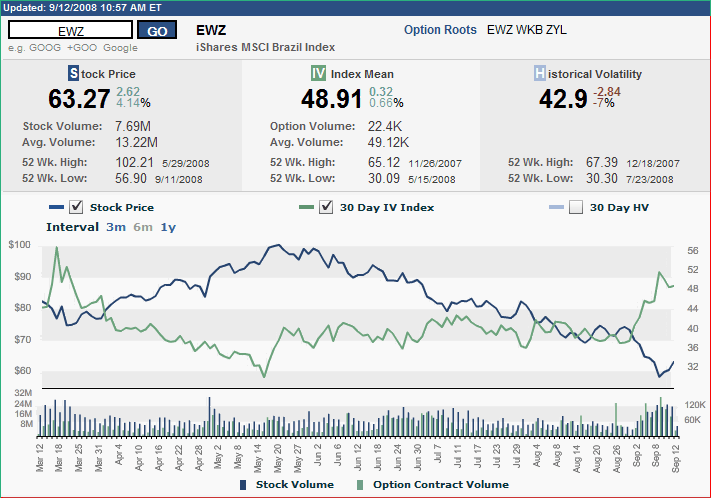
Truth be told, I could pick a ticker at random and have a compelling chart of implied volatility. Some, of course, are more compelling than others.

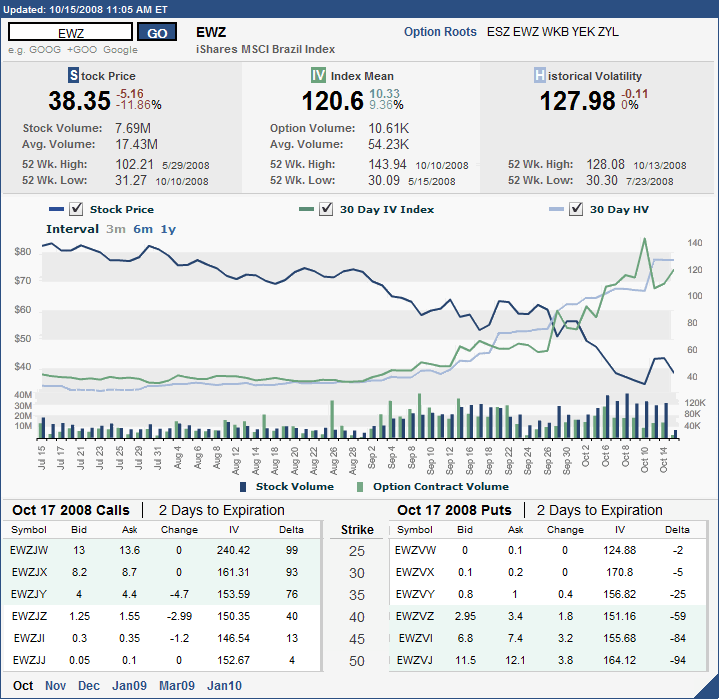
Take EWZ, for instance, the Brazil ETF. This resource-rich country has seen its ETF lose more than half of its value over the past year, coupled with a dramatic rise in volatility over the course of the past month.

In the chart below, courtesy of the International Securities Exchange, one can discern that implied volatility and historical volatility had been hovering in the range of 40 even as the ETF trended down during the summer. Starting in early September, the increase in volume in both the ETF and the options hints than an even wilder ride is coming.

In fact, implied volatility spiked from 40 to over 140, with historical volatility making similar gains. At the moment, both mean IV and HV are over 120, with both the near the money calls and puts expiring at the end of the week showing implied volatility readings in excess of 150. This is country risk at extreme levels.

Those with a directional preference who are looking to limit risk in high volatility environments may wish to look at bear call spreads for a short bias and bull put spreads for a long bias.

[source: International Securities Exchange]

[Disclosure: long EWZ at time of writing]

Monday, October 13, 2008

Institutional Interest High in These Nine Large Caps

Stocks of all sizes and shapes are trading up today, but which ones will continue to do well if the market holds up?
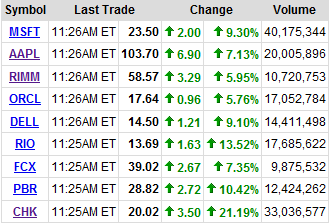
In the graphic to the right (courtesy of Yahoo) I highlight nine large cap stocks that appear to be the biggest targets of institutional interest not just today, but when the markets moved up in spurts last week too. Those that made the cut did so on the basis of several price factors and several volume factors. The list consists of five technology names (MSFT, AAPL, RIMM, ORCL, and DELL), two mining/metals stocks (RIO, FCX), and two energy stocks (PBR and CHK). Interestingly, two of the nine companies are based in Brazil.

At the very moment at least, these nine companies look to be at the top of the heap: quality stocks at attractive valuations, with considerable institutional interest. I would expect these names to continue to lead the way in subsequent bull moves.

Note that one company on this list may be somewhat of a special case. Chesapeake Energy (CHK) CEO Aubrey McClendon was forced to sell “substantially all” of his 33 million shares last week to meet a margin call. With that forced selling completed, the stock is bouncing back today.

Friday, September 12, 2008

Brazil Finding a Bottom?

As I noted yesterday in The U.S. VIX vs. a BRIC VIX, emerging markets have been struggling mightily in the past few months.

An excellent example of the weakness in emerging markets can be found in Brazil, where the Brazil country ETF (EWZ) fell 44.3% from a late May high to a low that was made yesterday. Now picking bottoms is a game best suited for those who are long on hubris and short on common sense, but there are several factors which lead me to believe that yesterday’s low may turn out to be an intermediate or long-term bottom.

From a purely technical perspective, the chart below shows Tuesday as the lowest close (omitted is the intra-day 52 week low from yesterday). Also on Tuesday, EWZ’s options volume hit a new high for 2008 and implied volatility spiked to levels not seen since the March panic. Of course, none of these factors guarantees a bottom, but taken together, and given the relative strength of EWZ once again today (up over 4% as I type this), they increase the likelihood of a profitable entry.

[source: International Securities Exchange]

[Disclosure: long EWZ at time of writing]

Monday, March 17, 2008

Portfolio A1 Doubles Down on Brazil

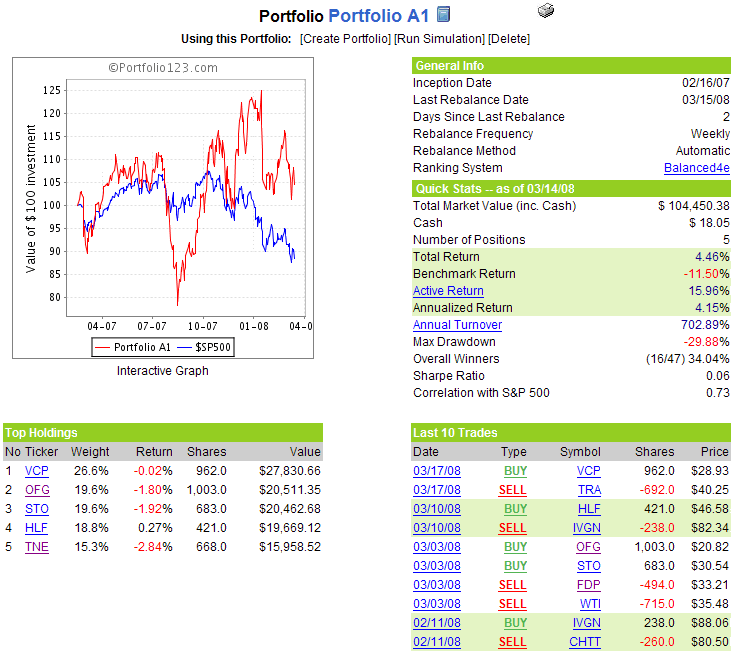
As a five stock portfolio that has sector concentration rules built in but no country or regional rules, there are occasional instances in which Portfolio A1 inadvertently takes multiple positions in a concentrated geographical area. This week is one of those instances, as the portfolio is selling fertilizer producer Terra Industries (TRA) after the company triggered an automatic sell rule by dropping 20% from the high during its holding period.

In lieu of TRA, the portfolio is adding Brazilian pulp and paper producer Votorantim Celulose e Papel SA (VCP), an ADR which I will henceforth conveniently refer to by their ticker. In Brazil Rallies While China Struggles, I recently noted how the Brazilian ETF (EWZ) had reflected the country’s recent superior performance relative to the more widely discussed China ETF (FXI); for those looking for individual Brazilian equities, you may wish to add VCP to you watch list, as it looks like it may have pulled back to technical support. VCP joins Brazilian telecom standout Tele Norte Leste Participacoes SA (TNE); together these two companies will now comprise approximately 42% of the portfolio.

In spite of some recent weakness, Portfolio A1 still holds net performance advantage of 16% over the benchmark S&P 500 index, with a 4.5% cumulative gain vs. an 11.5% cumulative loss for the SPX.

There no other changes to the portfolio for the coming week.

A snapshot of Portfolio A1 is as follows:

Tuesday, February 26, 2008

Brazil Rallies While China Struggles

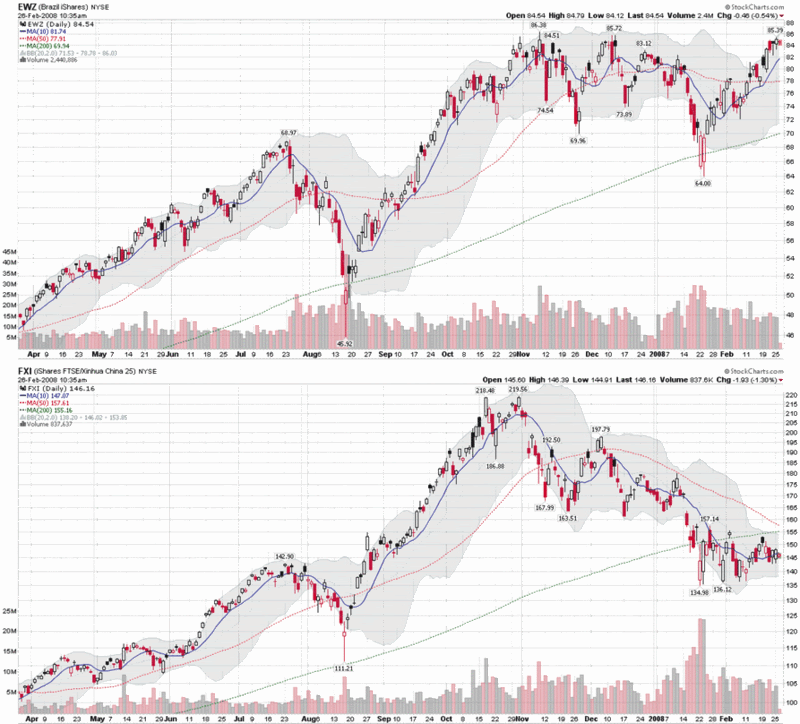
As the chart below shows, speculative money has been cautious about China since late October, but still bullish on Brazil, as indicated by the strong performance in EWZ, the iShares MSCI Brazil Index ETF. Not only is EWZ showing a gain for the year, but in an impressive display of strength, it has rallied more than 30% off of the January low. This performance puts EWZ not only well ahead of the most popular Chinese ETF, FXI, but also considerably ahead of the broad market emerging market ETF, EEM, known formally as the iShares MSCI Emerging Markets Index.

While EWZ is a great way to play the Brazilian market, there are several ADRs that are worth singling out as well. My Portfolio A1 holds Tele Norte Leste Participacoes SA (TNE) and has also been long Brasil Telecom Participacoes SA (BRP) in recent months, but there are even better plays. In fact, of the handful of long-term global holdings that I believe you could almost buy and forget about, two of my favorites are Brazilian giants. At the top of the list is Petroleo Brasileiro SA (PBR), a.k.a. Petrobras, the superbly managed national oil company that is pushing the envelope in the ultra-deep recovery space with their massive Tupi oilfield. Close behind is Vale (RIO), formerly know as Companhia Vale do Rio Doce, the metals and mining giant that recently extracted a 65% price increase in iron ore prices from Baosteel, the largest steel company in China.

In a healthy global economy, PBR and RIO are two of the best blue chip oil and iron plays out there. For those wishing a broader, more diversified play, EWZ is hard to beat, especially as Brazil continues to outpace China.

Friday, February 2, 2007

The VIX and 3% SPX Drops

What happens to the VIX when the SPX drops 3% in one day? Does the VIX provide any advance warning of a selloff or merely serve as a contrary indicator after the fact?

Since 1990, there have been 25 instances in which the SPX has fallen 3% or more in one day. In analyzing those movements, it is important to remember that volatility has a strong tendency to cluster; as a result, a majority of the data points I looked at happened to fall within the same month and many were during the same week as another 3% drop. This should not be surprising, as almost all of the SPX plunges from the last decade have been triggered by the Asian financial crisis (including the spillover into Russia and Brazil) and the unwinding of the dot com bubble.

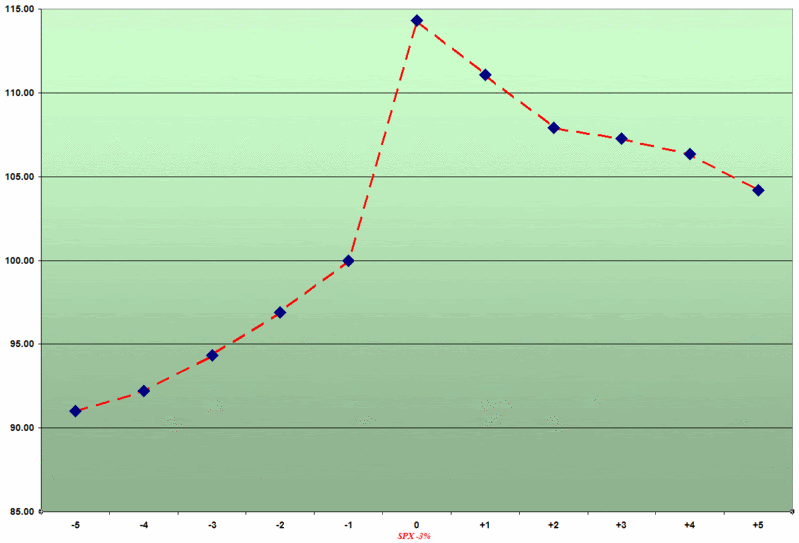
The following graphic depicts a composite view of changes in the closing price of the VIX on the 25 occasions from 1990 to the present in which the SPX has dropped 3%:


Note that the scales fixes the close on the day before the 3% drop at 100, so that percentage moves to and from that point are easier to calculate. It is worth highlighting that while the actual values of the VIX are not included here, only twice during this period did the SPX drop 3% with VIX values already below 20. In fact, the median value for the VIX prior to the SPX drop is 31.21, again partly reflecting the clustering of volatility that results in multiple sharp drops in the SPX.

On average, a drop in the SPX of 3% or more translates to a 14.3% spike in the VIX. More than half of the time, the day of the SPX 3% drop turned out to be the high in the VIX over this 11 day period. On average, half of that spike is retraced within two trading days and over 70% of that move is retraced in five days.

In future posts, I will discuss in greater detail the issue of the VIX providing advance warning of a selloff in the broader market. Suffice it to say that while the graph above shows that the VIX does jump approximately 10% in the four days before a 3% SPX move, there is not the obvious telltale movement in the day or two before the selloff that might get the attention of the casual observer.

DISCLAIMER: "VIX®" is a trademark of Chicago Board Options Exchange, Incorporated. Chicago Board Options Exchange, Incorporated is not affiliated with this website or this website's owner's or operators. CBOE assumes no responsibility for the accuracy or completeness or any other aspect of any content posted on this website by its operator or any third party. All content on this site is provided for informational and entertainment purposes only and is not intended as advice to buy or sell any securities. Stocks are difficult to trade; options are even harder. When it comes to VIX derivatives, don't fall into the trap of thinking that just because you can ride a horse, you can ride an alligator. Please do your own homework and accept full responsibility for any investment decisions you make. No content on this site can be used for commercial purposes without the prior written permission of the author. Copyright © 2007-2023 Bill Luby. All rights reserved.
 
Web Analytics