VIX Term Structure and VIX Forecasts
Last Friday, Jeff Kearns of Bloomberg had a story with the title VIX Futures Show Traders Betting Stock Rally to End that triggered a large number of emails from readers. The quote from the article that seemed to generate the most amount of interest was, “Investors surveyed by Macro Risk Advisors expect the VIX to jump to as much as 51.70 by year end.” In fact, the 51.70 data point was the average high print expected by respondents who were surveyed in April, when the VIX ranged from 33 to 46. That data point and the balance of the results from the Volatility Forecast Survey make for some interesting reading. Even more interesting, however, is the April 2008 Volatility Forecast Survey, in which respondents expected average realized volatility of 20.9% for the balance of 2008, with an average VIX high print of 34.4. One brave soul went out on a limb and predicted that the VIX would spike to a new all-time high of 50.
I guess nobody knew what a category 5 VIX hurricane looked like, so extrapolating from historical data, they were having trouble imagining what was coming.
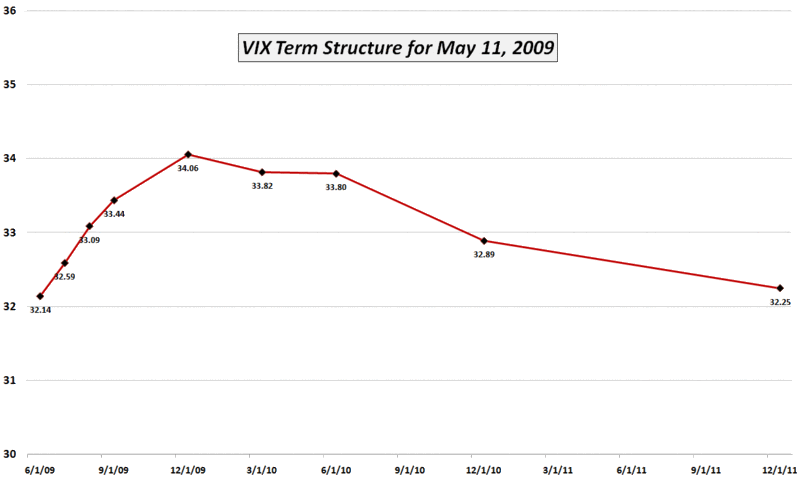
Getting back to the 2009 survey data, while I find it intriguing, I would put a lot less credence into survey data that is several weeks old than real-time market data. One can construct a VIX term structure graph from VIX futures or SPX options. My preference is for the latter approach, which yields a graph like the one below. Note that the slope of the VIX term structure is almost flat. Certainly the 0.11 differential between the front month and 2 ½ years out is in stark contrast to the 33.93 point differential from November 20, 2008, when the front month VIX was 81.07. Essentially, the consensus opinion is that current volatility measures are about where they should be, with no significant changes anticipated going forward.
Finally, while survey respondents likely had the best of intentions when constructing their volatility forecasts last month, there is nothing like current market data to get a sense of how investors are backing up their beliefs with large dollar value positions in the options market.

[source: CBOE, VIXandMore]


2 comments:
VIX above 33, i am expecting a near-term spike
We could also hedge ourselves using the VIX, I would mean going long the VIX and short another equity stock and Vice versa, great insight though on this post.
Post a Comment