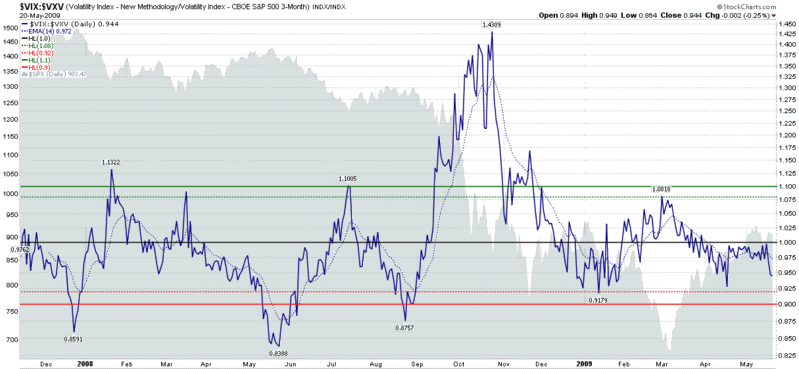
VIX:VXV Ratio Moving Toward Bearish Zone
Lately I have received quite a few requests to talk about the VIX:VXV ratio, something that I first blogged about back in December 2007, shortly after the VXV volatility index was launched.
The chart below is my standard VIX:VXV ratio chart and uses the 1.08 and 0.92 end of day closing levels as basic long and short signals. The last signal on the chart is a March 1st long signal that preceded the March bottom by a week. On April 19th the VIX:VXV ratio closed at .9276, but was below the 0.92 signal line on an intraday basis.
Yesterday, I saw some data that showed the VIX:VXV ratio below 0.92 during the trading session, but a review of the intraday chart tells me that while the VIX:VXV ratio was in the 0.9150 to 0.9200 area from about 9:50 a.m. to 10:10 p.m. ET, any lower numbers were likely to have been the result of bad prints.
For the record, while yesterday’s 0.944 close suggests a bearish bias, my reading of the ratio is that the preferred entry point for shorts positions would require waiting for a close of 0.92 or below.
[Note that while this basic interpretation of the VIX:VXV ratio sets parameters for long and short entries, it does not include recommendations about exits or how to incorporate the VIX:VXV ratio into a trading system.]

[source: StockCharts]


7 comments:
did it confirm bearish today?
Technically the VIX:VXV ratio can only confirm bearish with a close at or below 0.92 and given the current reading (about 0.99) that is not likely to happen.
Cheers,
-Bill
well... being long VIX worked on Thursday 5/21... Nice trade.
Hi Bill. Fantastic blog. If you don't mind, what is the difference between the VXV and the vix/q9 contract? VXV is an index calculated using 90 day implieds on spx stocks. the 3rd month VIX is the markets guess of where 30 day vol will be in 60 days. they settled within 4 cents of each other today. (5/21)
another question...
does the futures string of vix contracts give you the same idea as looking at front month spx options, 2nd month, etc? i like looking at the term structure of vol and i have been using the various VIX futures to do that. is that correct to do?
The futures string of vix contracts does give you about the same thing as the VIX:VXV ratio. I have an indicator based on that very idea. Basically it looks at the slope of the current vix and the forward futures contracts. It's currently giving a sell.
Sell of volatility or sell of the S&P and/or equities generally?
its a sell signal for the underlying
Post a Comment