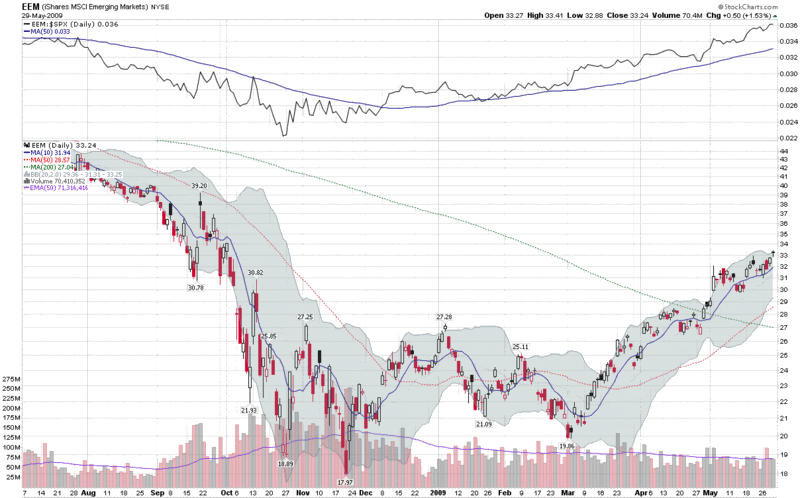
Chart of the Week: Emerging Markets
One of my best trades for 2009 has been a long position in EEM, the emerging markets ETF. The chart of the week below shows that emerging markets have been consistently outperforming the S&P 500 index since the beginning or January (see ratio study at top of chart) and was one of the first major equity groups to top its 200 day simple moving average (dotted green line) in late April. While the SPX has been going sideways during May, emerging markets have continued to tack on gains, bolstered by rising prices for commodities.
I would not be surprised to see EEM finding increasing resistance at several stages in the 34-40 range, but for now at least, I see no reason to exit EEM at least until its performance relative to the SPX begins to falter.


1 comments:
Hi Bill,
I'm hoping if you can clarify VIX futures and vix options for me. Say if I was to buy VIX futures, and sell a call options on it, would the call option position be covered? I see on CBOE that the VIX options and futures expires on the same date. I'm just a bit confused on the settlement value. Thank you,
Post a Comment