Showing posts with label composite. Show all posts

Thursday, March 15, 2007

More Unprecedented Elasticity in the VIX

Clearly, the markets and the VIX took some interesting twists and turns yesterday, but how unusual were those movements?

One interesting statistic is that yesterday’s VIX trading range was 24.8% of the prior day’s close. This has only happened nine times in the last decade and fully 5 of these 9 instances have occurred in the last three weeks!

Another interesting statistic is that the VIX, which is known more for spiking up than spiking down, finished yesterday 18.7% below the intra-day high. This has happened just six times since 1990 and twice (last June and two weeks ago today) in the past eight years. For those who may have some interest in these matters, each of these six occasions happened to fall during a bull market.

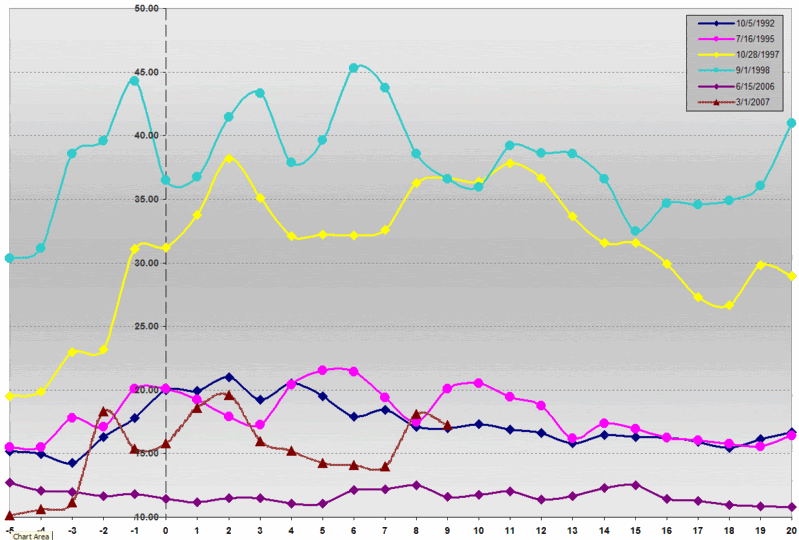
I put together my faithful composite historical graph of those six instances. It shows evidence of some additional echo volatility in the subsequent 20 trading days and the lack of a dramatic reversion to the mean which most spikes tend to demonstrate over this period. (An important heuristic is at work here: intra-day spikes tend to have much less subsidence than end of day and multi-day spikes, partly because the nature of intra-day spikes is that much of the subsidence happens before the close.)

If you look at the individual data points, however, (which include the first nine trading days following the 3/1/07 turmoil) some echo volatility is present, but, for the most part, volatility lessens substantially after the first ten trading days.

Wednesday, March 7, 2007

Elast-o-VIX

The events of last week gave us an opportunity to examine what happens when the VIX spikes 30% or more in one day. For the most part, the conclusion was that spikes of this magnitude generally represent a near-term VIX top; save some echo volatility spikes, they also indicate that the VIX should trend down from a large spike.

We are in uncharted territory once again this week, this time with the mean-reversion engine working overtime to snap the VIX back down from the low 20s to 15. In an unprecedented move, the VIX fell over 15% twice within five trading days, dropping 16% on 2/28 and 19% yesterday. Interestingly, the last time two 15% drops fell in reasonably close proximity was in June 2006, when they were ten days apart. Prior to that, there were only nine 15% drops in the previous 17 years and only two of those occurred in the decade leading up to the events of last June.

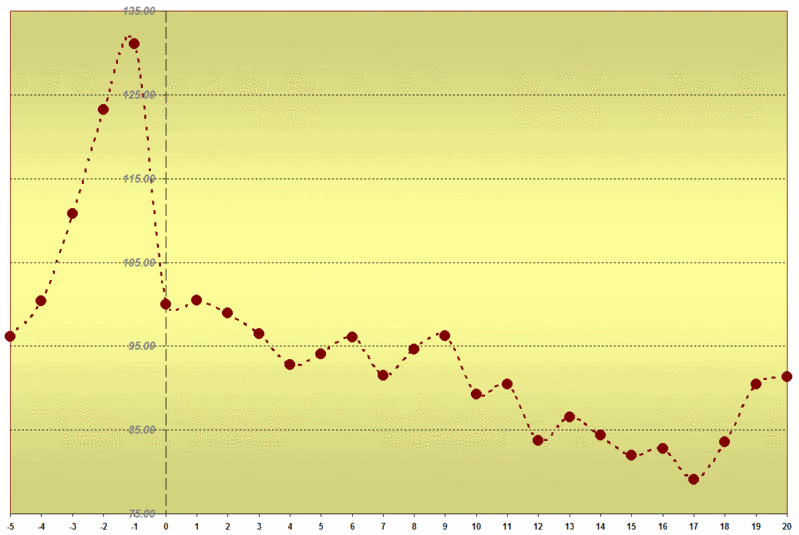
At one point yesterday, the VIX was down 20%. While it edged away from that number by the end of the trading day, I thought it might be instructive to look at the only three times in VIX history that it has fallen 20% in one day: 9/22/93; 4/15/94; and 6/15/06.

For those who are not familiar with the composite historical graphs I have included here in the past, the chart below takes the three data points above and normalizes the aggregate end of day values at 100 for the day in which the VIX fell 20% (also indicated with a “0” on the X axis and a vertical dashed line through it.) Here I have included the aggregate pricing data for the five days leading up to the 20% VIX drop (-5 to -1) and the twenty days immediately following the drop (1 to 20.)

The graph itself should tell the rest of the story. Personally, I found it most interesting that the 20% VIX drop was – at least in this historical context – a mean-reverting reaction that reversed three days of increasing volatility rather than striking out in a new direction. Interesting perhaps, but not surprising, as it is consistent with one of the recurring themes in this blog.

Thursday, March 1, 2007

VIX Spikes and Echo Volatility

The action in the futures this morning might be giving us our first glimpse of echo volatility – something I talked about at length in “What My Dog Can Tell Us About Volatility.” Essentially, echo volatility is a term I use to describe the tendency for markets to be more susceptible to volatility spikes in the wake of an initial volatility spike.

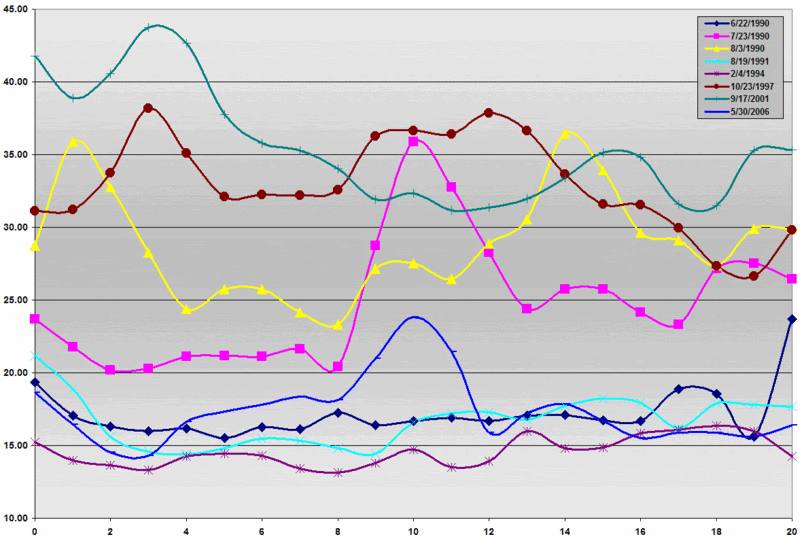
Some of this phenomenon can be seen in the behavior of the VIX in the 20 days following the eight instances in which the VIX spiked at least 30% in one day. In the graph below, day 0 is the VIX close on the day of the 30% spike. In the 20 days that follow, you can see evidence of echo volatility twice looking three days out, another two times on days 9 and 10, once more on day 14, and again on day 20. In sum, six of the eight 30% spikes showed evidence of at least one additional echo spike in the next 20 trading days.

With only eight data points, I am a long way from being able to say anything about statistical significance, but if all market-related talking heads were to bite their tongue until they had something to say with a 95% confidence interval, let’s just say CNBC wouldn’t exist, nor would this blog or any of the blogs over to the right in the “Blogs I Read” section.

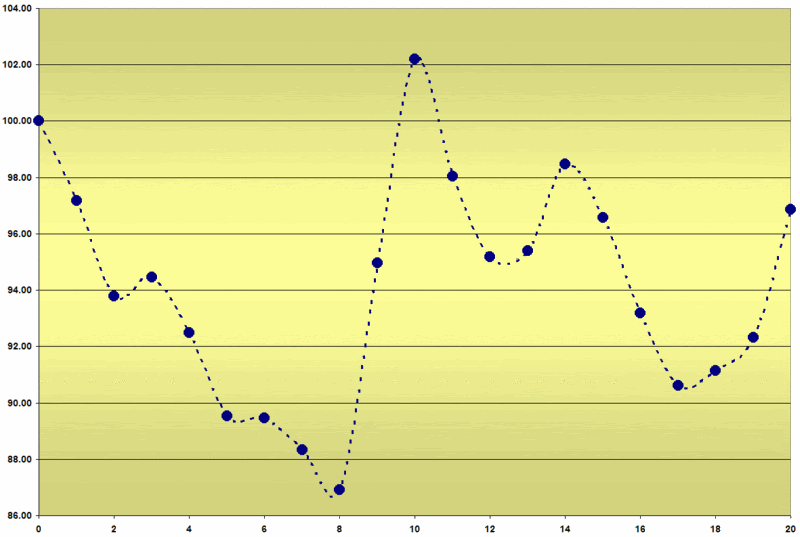
With that disclaimer out of the way, I decided to draw a composite picture of the 20 days following the eight instances of a 30% VIX spike. The resulting graph, below, gives values normalized at 100% of the aggregate close on the day of the 30% spike and suggests that those who are long the market should expect to contend with at least one substantial echo volatility spike in the next month and possibly one that looks and feels as dramatic as the one on February 27th.

In the meantime, use stops and always have a plan for how to handle the next spike in your back pocket. Don't forget to pet your dog once in awhile too...

Sunday, February 11, 2007

7% Friday VIX Spikes

So the VIX jumped 7% on Friday. Considering that the VIX also managed to set a new low for the 100 day SMA for the 34th consecutive day, it is a little early to declare the recent period of low volatility to be over. Still, Friday’s move warrants closer inspection.

Looking at how the VIX has bounced back from sub-10 closes, the current 11.10 reading is right in the lower middle of the range for where we “should be,” based on historical precedent 13 days removed from the 9.89 close on January 24th.

Is a 7% spike in the VIX unusual? Not really. It happens about once every two weeks, on average. Interestingly, a 7% jump occurs just 5.2% of the time on Fridays, but 10.2% of the time on any other day of the week. Monday sees the most volatility, a subject I will tackle in this space in the near future.

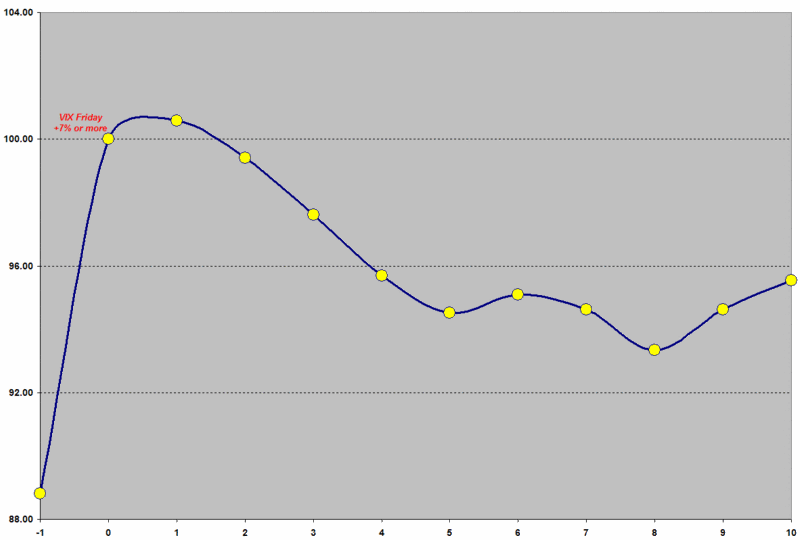
Getting back to the 7% rise on Fridays, as the adjacent composite graphic shows, there is typically a small (0.6%) follow-through on the day after the +7% Friday, with a gradual lessening of volatility over the course of the next 1 ½ weeks. The data for the high closes over the two weeks following these 45 Friday 7% spikes also supports the idea of the Friday spike and Monday follow-through as being the high point in this sequence is: fully 27% of the time, the Friday closed held up as the high close over the next two weeks; another 20% of the time, the Monday close turned out to be the high close during this period.

Going forward, keep in mind that many VIX spikes run out of steam 2-4 days after the initial move, so if Wednesday’s retails sales numbers or Bernanke's testimony does not put a scare into the markets and keep them on edge, the VIX spike will likely already have been trampled by the next bull leg.

For now I am slightly bearish on the VIX, with a close eye ready for the Tuesday-Wednesday action.

Wednesday, February 7, 2007

The Composite Sub-10 VIX Bounce

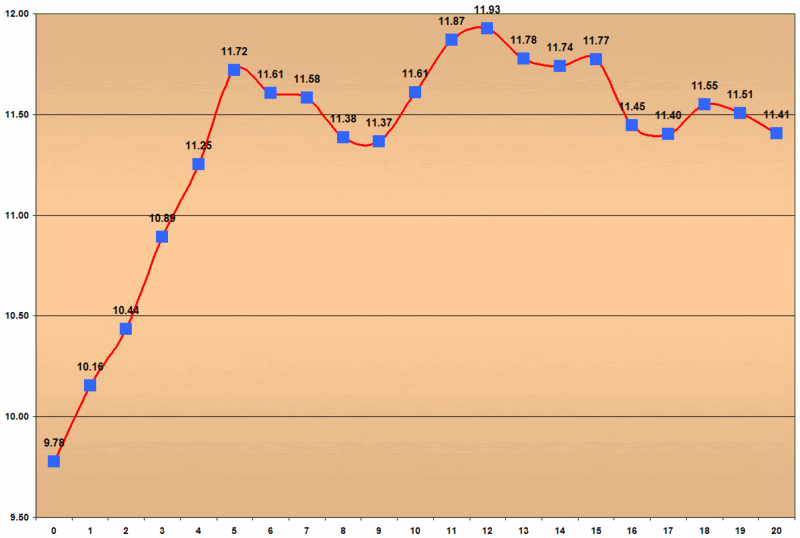
Yesterday we examined the ungainly rainbow Hydra that comprise the nine bounces from a sub-10 VIX close over the past 17 years. Today our intent is to bring order from that chaos in the form of a composite view of those bounces, where the aggregate picture tells a more concise story than the individual ones:


In brief, the composite picture is that of a five day ascent immediately following the sub-10 close, with some sideways meandering thereafter, an aggregate high 12 days out, and finally a slow return to lower levels.

Today’s close of 10.65 on day nine is the lowest day nine close to date. If the current pattern follows form, we will have a three day rise of a little more than half a point, followed by a gradual return to the current level over the next ten day period. As a reminder, it should be noted that the current ‘bounce’ has produced the lowest low for days 5-9 so far, with the distinct possibility that the day 3 peak of 11.46 will hold up as the high value for the 20 days following the sub-10 close.

Just to throw a monkey wrench into this thinking and get away from discussing a sub-10 close for a moment, today was the only the third time in the past 13 years that the VIX’s 20 day SMA made a new low. The last time this happened, on 11/22/06, the VIX jumped 15% in three days and 25% in 10 days. Prior to that, that last new 20 day SMA low was on 1/10/94, when the VIX moved up 13% in three days and 30% in 20 days.

Generally, I favor paying closer attention to the relative VIX values than the absolute values. I suspect the balance of the week will tell us which script to follow.

Monday, February 5, 2007

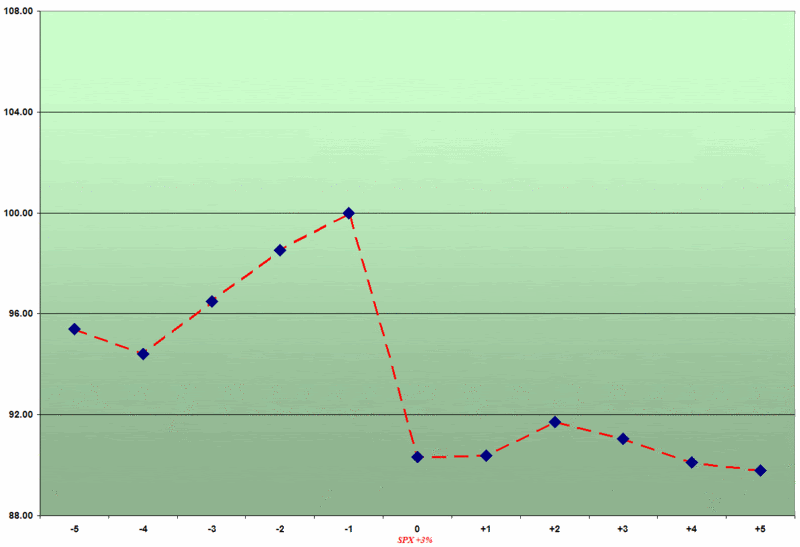
The VIX and 3% SPX Rises

Last week I looked at what happens to the VIX leading up to and following a 3% drop in the SPX. Turning to the VIX in the five days before and after a 3% rise in the SPX, the composite visual of these 26 data points is much less compelling:


I previously noted that while the VIX surging an average of 10% in the four days prior to the SPX drop might have put some on notice that fireworks could be on the horizon, given the VIX's beta of -7 to -8, there were enough 'false alarm' 10% moves in four days to make this a weak predictive signal. Looking the VIX in the five days before and after a 3% rise in the SPX, any predictive value in a VIX move is much weaker, on the order of 5% on average during the three days prior to the 3% VIX jump.

Two other comparative points are worth noting here:

  • Whereas a 3% or more drop in the SPX spiked the VIX 14.3%, on average, a 3% rise in the VIX only moved the VIX down 9.7%, on average
  • While the VIX retraced 70% of its gains in the five days following the 3% SPX drop, when the SPX jumped 3%, the VIX was below the -9.7% drop and still moving lower four and five days after the SPX move

I will return to the asymmetrical mean reversion tendencies of VIX spikes in future posts here, but for now I will conclude by puting forth the following working hypothesis: the widely accepted belief that the VIX generally reverts to the mean is more valid for sharp VIX moves up than sharp VIX moves down.

Friday, February 2, 2007

The VIX and 3% SPX Drops

What happens to the VIX when the SPX drops 3% in one day? Does the VIX provide any advance warning of a selloff or merely serve as a contrary indicator after the fact?

Since 1990, there have been 25 instances in which the SPX has fallen 3% or more in one day. In analyzing those movements, it is important to remember that volatility has a strong tendency to cluster; as a result, a majority of the data points I looked at happened to fall within the same month and many were during the same week as another 3% drop. This should not be surprising, as almost all of the SPX plunges from the last decade have been triggered by the Asian financial crisis (including the spillover into Russia and Brazil) and the unwinding of the dot com bubble.

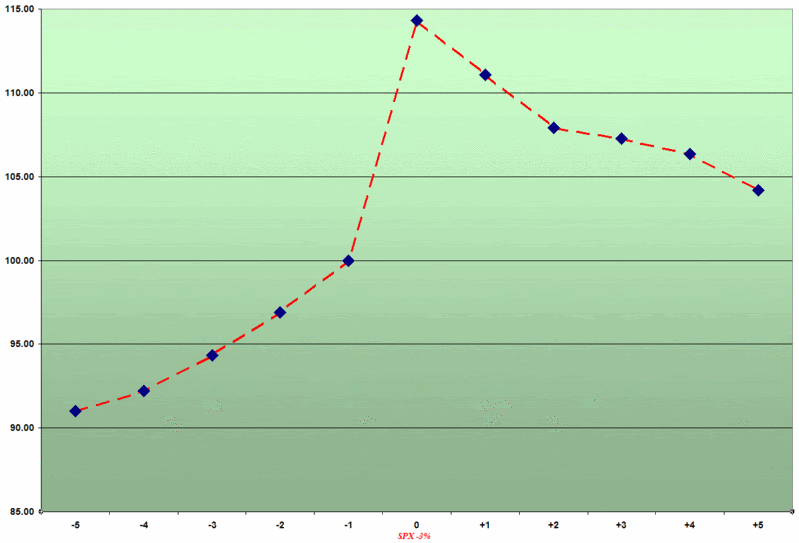
The following graphic depicts a composite view of changes in the closing price of the VIX on the 25 occasions from 1990 to the present in which the SPX has dropped 3%:


Note that the scales fixes the close on the day before the 3% drop at 100, so that percentage moves to and from that point are easier to calculate. It is worth highlighting that while the actual values of the VIX are not included here, only twice during this period did the SPX drop 3% with VIX values already below 20. In fact, the median value for the VIX prior to the SPX drop is 31.21, again partly reflecting the clustering of volatility that results in multiple sharp drops in the SPX.

On average, a drop in the SPX of 3% or more translates to a 14.3% spike in the VIX. More than half of the time, the day of the SPX 3% drop turned out to be the high in the VIX over this 11 day period. On average, half of that spike is retraced within two trading days and over 70% of that move is retraced in five days.

In future posts, I will discuss in greater detail the issue of the VIX providing advance warning of a selloff in the broader market. Suffice it to say that while the graph above shows that the VIX does jump approximately 10% in the four days before a 3% SPX move, there is not the obvious telltale movement in the day or two before the selloff that might get the attention of the casual observer.

DISCLAIMER: "VIX®" is a trademark of Chicago Board Options Exchange, Incorporated. Chicago Board Options Exchange, Incorporated is not affiliated with this website or this website's owner's or operators. CBOE assumes no responsibility for the accuracy or completeness or any other aspect of any content posted on this website by its operator or any third party. All content on this site is provided for informational and entertainment purposes only and is not intended as advice to buy or sell any securities. Stocks are difficult to trade; options are even harder. When it comes to VIX derivatives, don't fall into the trap of thinking that just because you can ride a horse, you can ride an alligator. Please do your own homework and accept full responsibility for any investment decisions you make. No content on this site can be used for commercial purposes without the prior written permission of the author. Copyright © 2007-2023 Bill Luby. All rights reserved.
 
Web Analytics