Showing posts with label sub-10. Show all posts

Saturday, February 18, 2017

Putting Low Stock Volatility to Good Use (Guest Columnist at Barron’s)

With spring training just getting underway in Florida and Arizona, I think it is appropriate that I once again have an opportunity to pinch hit for Steve Sears in his The Striking Price column for Barron’s.  Today’s column is called Putting Low Stock Volatility to Good Use (my title suggestions always seem to end up on the cutting floor) and builds upon some of the ideas I presented three years ago in Low Volatility:  How to Profit from a Quiet VIX.

If my memory is correct, this is the twentieth time I have been a guest columnist at Barron’s in this fashion and in keeping with tradition, I always try to make the column topical, particularly when there are some aspects of volatility that have investors more perplexed than usual.  Lately, it has been the persistent low VIX readings (including the first sub-10 VIX print in a decade) in conjunction with a new administration and extremely high policy uncertainty that has been difficult for investors to digest.  While I too have dedicated a fair amount of effort to square low volatility with high policy uncertainty, my research related to volatility has made it easier to stick with the trend instead of trying to anticipate a market turn.

Specifically, in the Barron’s article I note:

“Statistically, it turns out that the vaunted mean-reverting aspect of volatility is much more likely to kick in with a high VIX than a low VIX. Similarly, low volatility tends to cluster and persist for extended periods, defying skeptics. Specifically, when the VIX dips below 12 for several months, the historical record shows it can be expected to continue with similar readings for two years or more.”

As Barron’s is not necessarily the best place to try to shoehorn original research into a short column, I thought I could use this space to expand upon some of the points I made.  Specifically related to the clustering of low volatility, the graphic below shows that when the VIX closes below 12, it tends to persist in these low readings, clustering for several years, before remaining above 12 for even longer periods during high volatility regimes. 

[source(s):  CBOE, VIX and More]

A corollary to the above is that while investors often focus a good deal of their VIX analysis on mean reversion, it is important to note that mean reversion is much more predictable and tradeable following a VIX spike than after a significant decline in the VIX.

There are some other interesting statistics and ideas in the Barron’s column that I will address in other posts shortly, not the least of which addresses the 
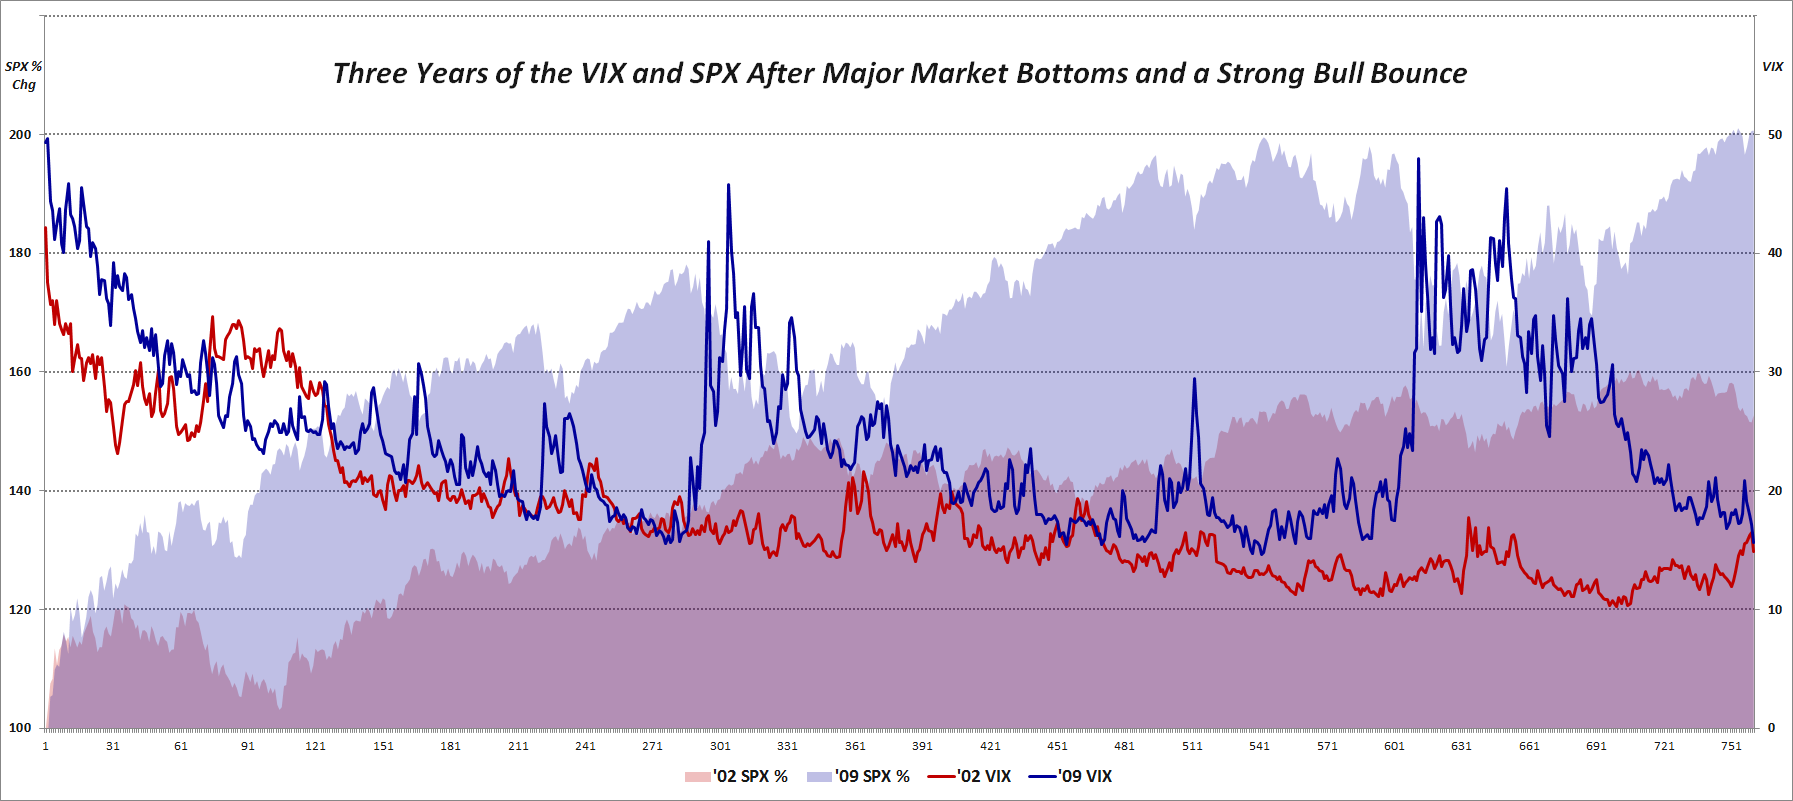
performance of the SPX in the years following extreme high and extreme low VIX readings.  Stay tuned.

Finally, since I enjoy being a pinch hitter so much, I thought I might highlight one pinch hitter for every new Barron’s column I write.  This time around I’d like to put the spotlight on Rusty Staub, who just happened to be at the zenith of his pinch-hitting duties when I moved to New York.  In the twilight of his career, the charismatic Rusty tied a National League record in 1983 with eight consecutive pinch hits and also tied the Major League record with 25 RBI from those (24) pinch hits.  Rusty finished his career with exactly 100 pinch hits and is currently 19th on the all-time pinch hit list.  I realize I have a long way to go to get to Rusty’s rarefied air, but 100 pinch hits is something to shoot for.

Related posts:

A full list of my (20) Barron’s contributions:


Disclosure(s): the CBOE is an advertiser on VIX and More

Tuesday, March 13, 2012

A VIX of 15!?! Meet the New Reality

When the VIX recently slid below 20.00 for an extended period, I sensed a noticeable unease about the state of the market in many traders and investors. Clearly a sub-20 VIX was underestimating the risks in the current and future market environment, they thought. When the VIX dipped below 18.00 that unease intensified and now with the VIX hovering around the 15.00 range and I can sense that quite a few are ready to grab the nearest pitchfork and riot about the inhumanity of the wayward VIX.

I will be the first to admit that there are a number of perplexing geopolitical, macroeconomic and other factors that pose real threats to the economy and to stocks, but I also believe that investors have become so fixated on some of the past problems that availability bias and disaster imprinting has clouded their judgment to the extent that they cannot separate the current market environment from the ghosts of markets past.

With this in mind, I created a chart to show what happened the last time we had a sharp market selloff and a subsequent bounce that lasted three years. The graphic below shows the percentage change in the SPX as well as the absolute VIX level in the three years following the October 2002 lows in the SPX as well as the three years following the March 2009 lows. Note that from 2002-2005, the SPX rallied about 53%; the current rally in the SPX from the March 2009 close is over 100%.

Turning to the VIX, it starts the sequence in the 42s in 2002 and in the 49s in 2009. Note that in both instances, the VIX had made it into the teens within one year of the beginning of the bull move. As the 2002 bull bounce continued, however, the VIX plummeted, spending a great deal of time in the 10-13 range, with a median value of 15.30 in the first three years of that bull market. The rally off of the 2009 bottom has been a different animal altogether, however, with forays down to the 15s being extremely rare (though it did happen on occasion in 2010 and 2011) and a median VIX of 22.84 during that same initial three years of the bull market.

Of course not all bull markets are the same (and there are many that will not concede that the current rally is a bone fide bull market) and every wall of worry is made of different types of stones, but at some point investors need to come to terms with the reality of a VIX of 15, particularly when we are looking at realized volatility that has been sub-10 for the last two months.

Related posts:

Disclosure(s): none

[sources: CBOE, Yahoo]

Friday, June 15, 2007

No Grunting, Please

Yesterday I spelled out my position on the unlikely return of a sub-10 VIX. Of course, the first thing I noticed when the markets opened today was that the VIX had fallen another 1.06 points to 12.58, meaning that a single digit VIX was suddenly not looking like a fanciful idea. I haven’t changed my opinion about the VIX trading in the 12.50 – 15.00 range, but I must confess to elevating an eyebrow for some of the morning’s action.

Frankly, I never anticipated that my drop shot back over the net to the Daily Options Report would be returned, but the fleet afoot Adam Warner pounced before you could say “VIX implosion” and detailed his thinking about how gravity might swallow the VIX whole during the next options cycle.

I recommend that you get the benefit of his thinking in its entirety, but for those who are on a strict mouse click quota, I have highlighted some of the salient points:

“Let's consider July options. They have 35 days until expiration. But I would strongly suggest this is not a typical 35 day stretch. Summer is slower to begin with, and have a holiday smack in the middle of this cycle. On a Wednesday no less, which invariably leads to an incredibly dull week.

If you net-buy options of any sort, you are buying time and the typical market action that the price implies. But you are not getting full time value here, rather something les than 35 days worth of fluctuation.

So as such, buyers are going to lower their bids.

Likewise sellers know they have less risk than in 35 normal days. Barring an *event*, there is a ton of dead time coming up. So they can offer cheaper.

Now back to the volatility calculation. It picks up NONE of this. As the price of an option gets cheaper and everything else stays the same (most notably time until expiration), it will spit out a lower volatility.

And to me we have a perfect storm brewing. The early parts of an expiration cycle generally produce lower volatility anyway as buy writes get rolled. Then comes the holiday, and not just a long weekend but a week long siesta.

Throw in the fact that summer is starting, and options are already on the high side relative to actual stock volatility and it just feels VERY vulnerable to a VIX crush.”

Mind you, I would hope that readers will not let their own feelings about whether Maria Sharapova or Ana Ivanovic is the better tennis player or more pixel-worthy influence your thinking about the VIX, but if teenage boys start flocking to this site to brush up on their market timing skills, at least I know that I will have contributed to the betterment of humanity in some small way.

Thursday, June 14, 2007

VIX Implosion Ahead?

Let me start off by saying that I would probably mention Adam Warner and his Daily Options Report more often on this blog, but in doing so I risk the possibility of engaging in an extended baseline VIX rally – and that might put everyone to sleep.

In his usually provocative manner, today Adam is talking about the possibility of a VIX implosion that might send the volatility index back into single digits.

I have chronicled the history of sub-10 VIX closes here in the past, but since February 27th, that subject has fallen off of my radar. First, I’ll start with some historical context. Adam mentions the possibility of the VIX imploding during the next options cycle. At current levels, a one month drop of about 30% would be needed to take us into single digits. While a VIX drop of 30% in one month is not unprecedented, the one month in which it happened, April 1994, came on the heels of 40% and 38% monthly gains in the VIX in the previous two months. Then it was a mean-reverting move; this time it won’t be.

Another factor that argues against a large VIX drop is VIX seasonality. As I have previously discussed, the VIX has a tendency to bottom out in June, before spiking dramatically in July, August and September.

Finally, it is always interesting to look at the implied volatility of VIX options. While these have dubious predictive value (see the lack of advance warning for February 27th in the preceding link, which mirrored the complacency prior to the May 2006 selloff,) it is worth noting that VIX IV is sitting just above the 52 week low.

In sum, while I think Adam’s VIX implosion scenario is highly unlikely, I’ll refrain from saying that it cannot happen. I applaud Adam for going out on a limb and being provocative, but with my VWSI looking out 10-20 days, I see the most likely scenario as the VIX continuing in a range of about 12.50 – 15.00 for the next options cycle. Not an exciting prediction, to be sure, but one which will provide me with an opportunity to harvest some theta.

Sunday, February 11, 2007

7% Friday VIX Spikes

So the VIX jumped 7% on Friday. Considering that the VIX also managed to set a new low for the 100 day SMA for the 34th consecutive day, it is a little early to declare the recent period of low volatility to be over. Still, Friday’s move warrants closer inspection.

Looking at how the VIX has bounced back from sub-10 closes, the current 11.10 reading is right in the lower middle of the range for where we “should be,” based on historical precedent 13 days removed from the 9.89 close on January 24th.

Is a 7% spike in the VIX unusual? Not really. It happens about once every two weeks, on average. Interestingly, a 7% jump occurs just 5.2% of the time on Fridays, but 10.2% of the time on any other day of the week. Monday sees the most volatility, a subject I will tackle in this space in the near future.

Getting back to the 7% rise on Fridays, as the adjacent composite graphic shows, there is typically a small (0.6%) follow-through on the day after the +7% Friday, with a gradual lessening of volatility over the course of the next 1 ½ weeks. The data for the high closes over the two weeks following these 45 Friday 7% spikes also supports the idea of the Friday spike and Monday follow-through as being the high point in this sequence is: fully 27% of the time, the Friday closed held up as the high close over the next two weeks; another 20% of the time, the Monday close turned out to be the high close during this period.

Going forward, keep in mind that many VIX spikes run out of steam 2-4 days after the initial move, so if Wednesday’s retails sales numbers or Bernanke's testimony does not put a scare into the markets and keep them on edge, the VIX spike will likely already have been trampled by the next bull leg.

For now I am slightly bearish on the VIX, with a close eye ready for the Tuesday-Wednesday action.

Wednesday, February 7, 2007

The Composite Sub-10 VIX Bounce

Yesterday we examined the ungainly rainbow Hydra that comprise the nine bounces from a sub-10 VIX close over the past 17 years. Today our intent is to bring order from that chaos in the form of a composite view of those bounces, where the aggregate picture tells a more concise story than the individual ones:


In brief, the composite picture is that of a five day ascent immediately following the sub-10 close, with some sideways meandering thereafter, an aggregate high 12 days out, and finally a slow return to lower levels.

Today’s close of 10.65 on day nine is the lowest day nine close to date. If the current pattern follows form, we will have a three day rise of a little more than half a point, followed by a gradual return to the current level over the next ten day period. As a reminder, it should be noted that the current ‘bounce’ has produced the lowest low for days 5-9 so far, with the distinct possibility that the day 3 peak of 11.46 will hold up as the high value for the 20 days following the sub-10 close.

Just to throw a monkey wrench into this thinking and get away from discussing a sub-10 close for a moment, today was the only the third time in the past 13 years that the VIX’s 20 day SMA made a new low. The last time this happened, on 11/22/06, the VIX jumped 15% in three days and 25% in 10 days. Prior to that, that last new 20 day SMA low was on 1/10/94, when the VIX moved up 13% in three days and 30% in 20 days.

Generally, I favor paying closer attention to the relative VIX values than the absolute values. I suspect the balance of the week will tell us which script to follow.

Tuesday, February 6, 2007

Bouncing Back From a Sub-10 VIX

Several readers have asked about the significance of yet another sub-10 VIX close on 1/24/07. Many seem to be convinced that the markets have entered into an extended period of low volatility where a single digit VIX reading is no longer necessarily an automatic signal to buy some VIX calls. The grumbling is along the lines of “it’s different this time,” but the real concern is that things are going to be different in the volatility world for a long time to come. Not only will the old rules not apply, but it may be awhile before the new rules are apparent.

In the last couple of days, both the New York Times and The Economist have weighed in with warnings about the calm before the storm. Not surprisingly, these publications are not alone. Felix Zalauf has predicted that the VIX will be back over 20 this year. My decaying VIX calls notwithstanding, I am still looking for a significant bump in the road sometime during the next two options cycles. If I turn out to be wrong, it will be no consolation to have learned company on my side; in the markets, one always does.

Back to the sub-10 VIX.

A graph of the VIX for the twenty days following each of the nine instances in which the VIX closed below 10 looks like this:

It is probably important to repeat some earlier caveats to the effect that building a trading strategy around 9 data points in 17 years is probably not a great use of one’s time. I should also reiterate that of those 9 instances, 4 fall on consecutive trading days in 1993 and another 2 are from consecutive trading days in 2006, so it is easy to argue that the history of sub-10 VIX closes includes a mere 5 data points. Recognizing this, if you study at the chart above, you can see that almost half of the lines are the same data, with the time phase shifted one or more days.

Regarding the current bounce from a sub-10 VIX, as of 2/5/07 this is the weakest bounce among the group yet, currently sitting below the previous weakest bounce, which just happens to be the last sub-10 close in December 2006. Two data points don’t necessarily make a trend, but they do provide some food for thought. Note that in all instances of a sub-10 close to date, most of the bounce over the next 20 trading days had already been completed in five trading days.

Wednesday, January 24, 2007

A History of Sub-10 VIX Closes

Today the CBOE Volatility Index closed under 10.00 for just the ninth time since it was launched in 1993. Three questions immediately arise from this fact:

  1. What is the history of sub-10 closes?
  2. What does the current one mean?
  3. How might the current situation be tradeable?

Today we will start with the first question, touch on the second one, and push the third one off until tomorrow morning.

The 1993-94 Lows

Looking at the history books, prior to 2006, the VIX closed below 10.00 on five occasions: four consecutive days in late December 1993; and once in late January 1994. In all instances, the VIX rebounded sharply higher 3, 5, 10, 20 and 50 days later. For the record, the SPX was little changed in the 3/5/10/20/50 day time from the four consecutive days in December 1993, but did sell off following the January 1994 low.

The details are as follows:

Sub-10 VIX #1-4) On 12/23-24/1993 and 12/27-28/1993 the VIX closed at 9.31, 9.48, 9.70 and 9.82, respectively. For comparison purposes, the SPX closed in the range of 467-471 during the same period. Three days later, the VIX was already up 6%, 10%, 10% and 19%. By the fifth trading day, those same gains had been extended to 15%, 23%, 30% and 21% from those closes. Ten trading days from the VIX lows, the VIX was up 21%,16%, 11% and 15%, while the SPX was anywhere between flat to up 1.0%. Twenty trading days from the lows, the VIX still showed cumulative gains of 20%, 17%, 20% and 16% from the original lows, with the SPX flat to up 1.6%. The more dramatic action came in the next 30 trading days, as 50 days from the original lows, the VIX was trading between 14.41 and 16.23, for cumulative gains of 72%, 50%, 57% and 47%. By the 50 day mark, the SPX had drifted down slightly, between -0.6% and -1.0% of the corresponding December close. The bottom line: the VIX was a good long at these lows and the SPX did not move for the next 50 trading days. In fact, there was no substantial drop (single day or cumulative) in the SPX until February 1994 and the SPX drifted sideways until the end of March 1994.

Sub-10 VIX #5) About a month later, on 1/28/1994, the VIX closed at 9.94, the last time it would close that low until November 2006. Looking at the same 3/5/10/20/50 day trading frame, the VIX rallied from that low to 10.61, 15.25, 14.46, 14.87 and 16.62, representing gains of 7%, 53%, 45%, 50% and 67% from the low. This time there was movement in the SPX, as it posted moves of +0.7%, -2.3%, -1.8%, -2.4% and -6.5% over the corresponding 3, 5, 10, 20 and 50 trading day periods. The big move behind the SPX numbers was a -2.3% drop in the SPX on the 5th trading day following the 1/28 low. This also happens to be the 28th, 29th, 30th and 31st trading day following the four consecutive December 1993 VIX lows. For the next 65 trading days, the SPX slid steadily lower, from 469 to 460, before dropping another 21 points over the course of four trading days.


A New Era in 2006-07?

Sub-10 VIX #6-7) On 11/20-21/2006, the VIX closed below 10.00 for the first time in a dozen years. While the 50 day ROI calculations are still two weeks away, the 3/5/10/20 day analysis shows gains of 8%, 17%, 13% and 3% for the first date and 24%, 9%, 14% and 4% for the second date. These VIX lows occurred in the fourth month of what is now a continuing six month upward move in the SPX, which has it currently 2.7% and 2.8% above the corresponding November values. There was a -1.4% drop in the SPX three trading days after one close and four trading days after the other close, on 11/27/06. I would not consider this drop to be noteworthy, however, as it was fully retraced over the course of the next two trading days and indeed the SPX has moved decisively higher over the past two months.

Sub-10 VIX #8) On 12/14/2006, the VIX once again closed below the psychologically significant 10.00 barrier. In the subsequent 3/5/10/20 day period, the VIX has had relatively tepid gains of 3%, 6%, 16% and 6%. The SPX has been drifting sideways for most of this period, but with today’s strong move now stands 1.0% above the 12/14 close.


Interpretation of the Current (#9) Sub-10 Close

To say that the VIX has closed under the 10.00 mark nine times is to stretch the truth a bit, as some of these daily closes might better be considered as multiple instances of two short-term volatility lulls in late 1993 to early 1994 and late 2006 to early 2007. Each of these two periods had a multiple days of consecutive sub-10 closes followed by an “echo low” approximately one month later. So far, today’s sub-10 close can only be considered another echo low, until we see how the balance of the current VIX lull plays out.

This categorization has important statistical implications. Is it two clusters of lows or nine independent data points? Either way, the small sample size has little statistical validity, but it is harder still to draw conclusions from two data points scattered over the course of 15 years.

Still, the data reflect that for each of the previous sub-10 closes, the VIX was higher 3, 5, 10, 20 and 50 days after the sub-10 close. For the 20 day period, the VIX has always rallied at least 10% and an average of 19% from the low. For the 10 day period, the returns are more widely dispersed, but the average is 22%. If we look out 50 days, the minimum return is 47% and the average return is 60%. The important caveat is that the 50 day ROI data do not yet include reaction to the 2006-07 VIX lows.

Now that investors have become somewhat accustomed to the low VIX numbers, we’ve been hearing the “It’s different this time!” calls for the past few months – and perhaps it is. Today is the 22nd day in a row that the VIX has set a new low for the 100 day SMA. I’m not convinced that it is different this time, but I do think that any knee-jerk reaction to buying VIX calls is not the best way to approach the current situation.

DISCLAIMER: "VIX®" is a trademark of Chicago Board Options Exchange, Incorporated. Chicago Board Options Exchange, Incorporated is not affiliated with this website or this website's owner's or operators. CBOE assumes no responsibility for the accuracy or completeness or any other aspect of any content posted on this website by its operator or any third party. All content on this site is provided for informational and entertainment purposes only and is not intended as advice to buy or sell any securities. Stocks are difficult to trade; options are even harder. When it comes to VIX derivatives, don't fall into the trap of thinking that just because you can ride a horse, you can ride an alligator. Please do your own homework and accept full responsibility for any investment decisions you make. No content on this site can be used for commercial purposes without the prior written permission of the author. Copyright © 2007-2023 Bill Luby. All rights reserved.
 
Web Analytics