Showing posts with label volatility clusters. Show all posts

Sunday, February 26, 2017

Clustering of Volatility Spikes

Last week, my Putting Low Stock Volatility to Good Use (Guest Columnist at Barron’s) triggered a bunch of emails related to the clustering of low volatility.  Most readers expressed an interest in the phenomenon of volatility clusters occurring in both high and low volatility environments and were curious about the differences between high and low volatility clusters.

When it comes to measuring volatility clusters I am of the opinion that realized or historical volatility is a more important measurement than implied volatility measurements, such as is provided by the VIX.  When I think in terms of VIX spikes, I generally focus on two single-day realized volatility thresholds:  a 2% decline in the S&P 500 Index and a 4% decline.

The graphic below is in many respects the inverse of the graphic in Putting Low Stock Volatility to Good Use (Guest Columnist at Barron’s) – and this should come as no surprise.  Simply stated:  while both high volatility and low volatility cluster in the short-term, volatility regimes tend to persist for several years, so it is very rare to see a clustering of high and low volatility in the same years.  This is exactly the principle I laid out more than ten years ago regarding echo volatility in What My Dog Can Tell Us About Volatility.

[source(s):  CBOE, Yahoo, VIX and More]

Note also that in spite of all the talk in the past few years of the potential implosion of the euro zone, a hard landing in China, central banks across the globe creating the seeds of our destruction, increasingly bipartisan politics creating deep divides across the nation, etc., etc. – volatility has been relatively mild during the past 5-6 years.

The interesting thing about volatility regimes is that they eventually transition from low volatility environments to high volatility environments and vice versa and create what I call VIX macro cycles in the process.  The volatility transition phases are some of the most interesting times in the market and can certainly be some of the most profitable.  These inflection points are sure to be a target of some of my future writing on volatility.

So, as VIX and More sails off into its second decade of publication, I vow to flesh out some of my evolving thinking on subjects I have touched upon above (some of which have lain dormant in this space for several years) at the same time I charge off into new areas.  While I will continue to have a laser focus on volatility (particularly its global, multi-asset class aspects), it is time to pay more attention to the “and More” portion of this title of this blog and make a push into new frontiers.  Said another way:  my thinking likes to cluster, but it likes to spike as well.

Finally, most posts tend to touch on one or two key ideas, so I typically put a half dozen or so links below that I refer to as “Related posts.”  Today, it seems as if I have touched briefly on so many subjects that more links (I’m sure today’s is a new record) seem appropriate and instead of referring to these as related posts, they are now officially Further Reading going forward.  Enjoy!

Further Reading:
For those who may be interested, you can always follow me on Twitter at @VIXandMore

Disclosure(s): none

Monday, February 20, 2017

SPX 1, 2 and 3-Year Returns Following Top and Bottom Five (and Ten) VIX Average Annual Readings

On Saturday, I posted Putting Low Stock Volatility to Good Use (Guest Columnist at Barron’s) and used that opportunity to expand upon some of the points I raised in my February 18th column for Barron’s.  Specifically, I addressed the issue of the clustering of low volatility and used a graphic to show that when the VIX closes below 12, it tends to persist in these low readings, clustering for several years, before remaining above 12 for even longer periods during high volatility regimes.  

Another claim I made in the Barron’s article (Putting Low Stock Volatility to Good Use) that I thought might benefit from a little graphical support was my contention:

“VIX data suggests the low volatility provides a foundation for extended bullish moves in stock. Look at the five highest and lowest average annual VIX readings and calculate the performance of the Standard & Poor’s 500 index one, two, and three years after the VIX extremes. After one year, the S&P performance following the low VIX is about 20% higher than after the high VIX. For two years, the difference jumps to 40% and by the third year the cumulative performance differential is approximately 90%. Wariness aside, low volatility begets low volatility and is generally bullish for stocks.”

Now there are two ways to compare percentages and the best way for me to illustrate this is with an example.  If we are comparing 5% with 4% is the 5% value 25% higher than 4% or is it 1% higher?  You can make a case for either comparison, one of which is made with division and is more of a pure percentage calculation, while the other which is made by subtraction and is perhaps best thought of in terms of percentage points.  In the Barron’s article, I used the division/percentage method, which is the norm when comparing numbers that are not percentages in and of themselves.  This time around I will try to minimize confusion and use the subtraction/percentage points approach instead.

In the first of the two graphics below I have calculated the SPX 1-year, 2-year and 3-year returns following the years with the five highest average VIX values (2008, 2009, 2002, 2001 and 1998) with a dashed black line as well as the years with the five lowest average VIX values (1994, 1993, 2006, 2005 and 1994) with a solid double blue line.  In all three time frames, the better returns followed the lower VIX readings and I used a green area series to show the (percentage point) difference.

[source(s):  CBOE, Yahoo, VIX and More]

For comparison purposes, in the second graphic below I have plotted the same SPX 1-year, 2-year and 3-year returns following the years with the ten highest average VIX values as well as the years with the ten lowest average VIX values.  Once again, in all three time frames, the better returns followed the lower VIX readings, though in this instance the performance gap between the lower VIX readings and higher VIX readings is somewhat reduced.

[source(s):  CBOE, Yahoo, VIX and More]

I offer up these graphics because I maintain that there are many skeptics regarding not only the persistent clustering of low VIX readings, but also related to the lack of robust data showing the effect of mean reversion during low volatility regimes.  As I have noted previously, mean reversion is much more predictable and tradeable following a VIX spike than after a significant decline in the VIX.

Follow me on Twitter at:  @VIXandMore

Related posts:


Disclosure(s): the CBOE is an advertiser on VIX and More

Saturday, February 18, 2017

Putting Low Stock Volatility to Good Use (Guest Columnist at Barron’s)

With spring training just getting underway in Florida and Arizona, I think it is appropriate that I once again have an opportunity to pinch hit for Steve Sears in his The Striking Price column for Barron’s.  Today’s column is called Putting Low Stock Volatility to Good Use (my title suggestions always seem to end up on the cutting floor) and builds upon some of the ideas I presented three years ago in Low Volatility:  How to Profit from a Quiet VIX.

If my memory is correct, this is the twentieth time I have been a guest columnist at Barron’s in this fashion and in keeping with tradition, I always try to make the column topical, particularly when there are some aspects of volatility that have investors more perplexed than usual.  Lately, it has been the persistent low VIX readings (including the first sub-10 VIX print in a decade) in conjunction with a new administration and extremely high policy uncertainty that has been difficult for investors to digest.  While I too have dedicated a fair amount of effort to square low volatility with high policy uncertainty, my research related to volatility has made it easier to stick with the trend instead of trying to anticipate a market turn.

Specifically, in the Barron’s article I note:

“Statistically, it turns out that the vaunted mean-reverting aspect of volatility is much more likely to kick in with a high VIX than a low VIX. Similarly, low volatility tends to cluster and persist for extended periods, defying skeptics. Specifically, when the VIX dips below 12 for several months, the historical record shows it can be expected to continue with similar readings for two years or more.”

As Barron’s is not necessarily the best place to try to shoehorn original research into a short column, I thought I could use this space to expand upon some of the points I made.  Specifically related to the clustering of low volatility, the graphic below shows that when the VIX closes below 12, it tends to persist in these low readings, clustering for several years, before remaining above 12 for even longer periods during high volatility regimes. 

[source(s):  CBOE, VIX and More]

A corollary to the above is that while investors often focus a good deal of their VIX analysis on mean reversion, it is important to note that mean reversion is much more predictable and tradeable following a VIX spike than after a significant decline in the VIX.

There are some other interesting statistics and ideas in the Barron’s column that I will address in other posts shortly, not the least of which addresses the performance of the SPX in the years following extreme high and extreme low VIX readings.  Stay tuned.

Finally, since I enjoy being a pinch hitter so much, I thought I might highlight one pinch hitter for every new Barron’s column I write.  This time around I’d like to put the spotlight on Rusty Staub, who just happened to be at the zenith of his pinch-hitting duties when I moved to New York.  In the twilight of his career, the charismatic Rusty tied a National League record in 1983 with eight consecutive pinch hits and also tied the Major League record with 25 RBI from those (24) pinch hits.  Rusty finished his career with exactly 100 pinch hits and is currently 19th on the all-time pinch hit list.  I realize I have a long way to go to get to Rusty’s rarefied air, but 100 pinch hits is something to shoot for.

Related posts:

A full list of my (20) Barron’s contributions:


Disclosure(s): the CBOE is an advertiser on VIX and More

Friday, February 2, 2007

The VIX and 3% SPX Drops

What happens to the VIX when the SPX drops 3% in one day? Does the VIX provide any advance warning of a selloff or merely serve as a contrary indicator after the fact?

Since 1990, there have been 25 instances in which the SPX has fallen 3% or more in one day. In analyzing those movements, it is important to remember that volatility has a strong tendency to cluster; as a result, a majority of the data points I looked at happened to fall within the same month and many were during the same week as another 3% drop. This should not be surprising, as almost all of the SPX plunges from the last decade have been triggered by the Asian financial crisis (including the spillover into Russia and Brazil) and the unwinding of the dot com bubble.

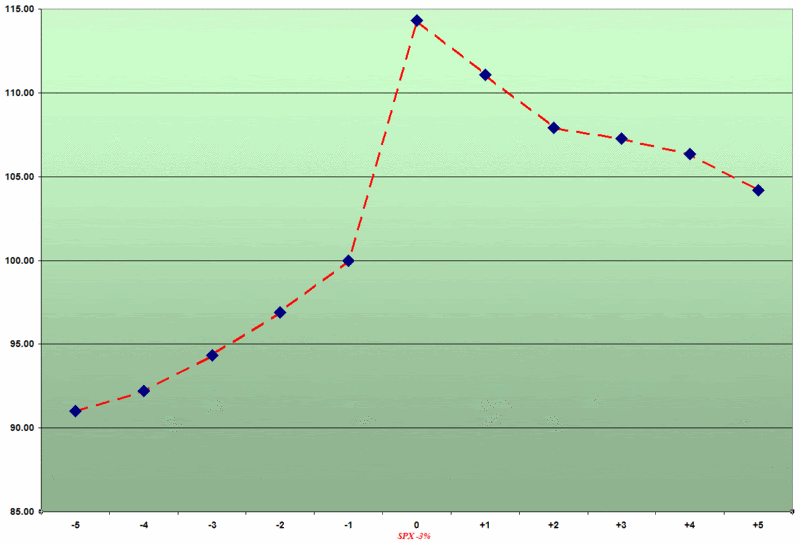
The following graphic depicts a composite view of changes in the closing price of the VIX on the 25 occasions from 1990 to the present in which the SPX has dropped 3%:


Note that the scales fixes the close on the day before the 3% drop at 100, so that percentage moves to and from that point are easier to calculate. It is worth highlighting that while the actual values of the VIX are not included here, only twice during this period did the SPX drop 3% with VIX values already below 20. In fact, the median value for the VIX prior to the SPX drop is 31.21, again partly reflecting the clustering of volatility that results in multiple sharp drops in the SPX.

On average, a drop in the SPX of 3% or more translates to a 14.3% spike in the VIX. More than half of the time, the day of the SPX 3% drop turned out to be the high in the VIX over this 11 day period. On average, half of that spike is retraced within two trading days and over 70% of that move is retraced in five days.

In future posts, I will discuss in greater detail the issue of the VIX providing advance warning of a selloff in the broader market. Suffice it to say that while the graph above shows that the VIX does jump approximately 10% in the four days before a 3% SPX move, there is not the obvious telltale movement in the day or two before the selloff that might get the attention of the casual observer.

DISCLAIMER: "VIX®" is a trademark of Chicago Board Options Exchange, Incorporated. Chicago Board Options Exchange, Incorporated is not affiliated with this website or this website's owner's or operators. CBOE assumes no responsibility for the accuracy or completeness or any other aspect of any content posted on this website by its operator or any third party. All content on this site is provided for informational and entertainment purposes only and is not intended as advice to buy or sell any securities. Stocks are difficult to trade; options are even harder. When it comes to VIX derivatives, don't fall into the trap of thinking that just because you can ride a horse, you can ride an alligator. Please do your own homework and accept full responsibility for any investment decisions you make. No content on this site can be used for commercial purposes without the prior written permission of the author. Copyright © 2007-2023 Bill Luby. All rights reserved.
 
Web Analytics