All-Time VIX Spike #11 (and a treasure trove of VIX spike data)
Today was one of those days that caught a lot of people off guard. Halfway through today’s trading session stocks we largely unchanged, then some pockets selling began when results of the elections in Italy started trickling in, suggesting the possibility of a deadlock in the Italian parliament and perhaps the need for another round of elections.
The governmental chaos is largely the result of rise of two intriguing political figures. One of these is the phoenix known as Silvio Berlusconi and his People of Freedom (PDL) party, which is anti-austerity and has proposed a policy of massive tax cuts and talked about the possibility of leaving the euro. The bigger electoral surprise is Beppe Grillo and the Five Star Movement (M5S), where Grillo’s populist agenda and anti-corruption message have resonated with voters. Both Berlusconi and Grillo have had a much stronger influence on the elections than most had anticipated and with Italy’s relationship with the euro zone now in question, the euro fell to under 1.31 against the dollar for the first time in six weeks.
U.S. stocks, which had seemed impervious to the sequestration threat, began selling off sharply as a result of the confusion about the future of the Italian government, with selling gathering steam during the second half of today’s session and accelerating sharply during the last hour, when the S&P 500 index fell more than 1% and the VIX spiked 14.4%.
For the full day, the SPX was down 1.83% and the VIX was up 34.02%. The 34% spike in the VIX makes it the eleventh largest one-day spike in the 24 years of VIX historical data going back to 1990.
The first question on everyone’s mind is what the implications of the VIX spike are for stock prices and volatility going forward. The truth is that the historical record following a large one-day VIX spike is somewhat spotty. The table below captures some data from the top 20 one-day VIX spikes. Note that on average (here is where I like to remind everyone that it is possible to drown crossing a stream that is one inch deep ‘on average’) stocks generally outperformed following a big VIX spike for up to one week (SPX ROI +1 to +5 days) and also performed well looking out more than two months. From one week to two months, however, stocks have underperformed following a large VIX spike.
Note that the table below is based on a small data set and if one extracts subsets of this data for the VIX at certain absolute levels or during selected periods or even relative to the magnitude of the change in the SPX, it is possible to draw some very different conclusions. Part of the reason for this may be due to the sample size and part of the answer may be that a clear-cut interpretation of this data is not easy to extract. For these reasons, I have included a fair amount of relevant data and encourage readers to draw their own conclusions.
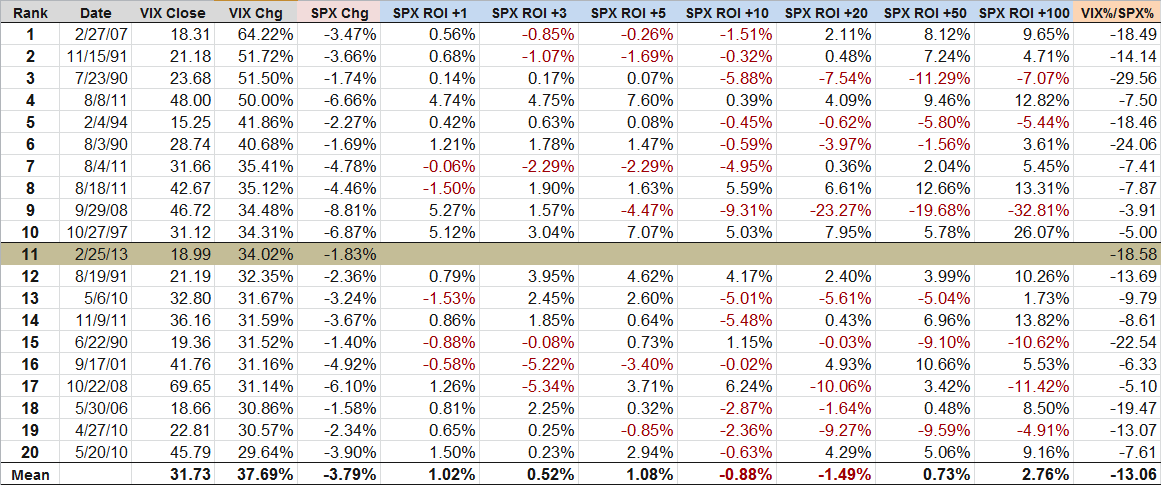
[source(s): CBOE, Yahoo, VIX and More]
For those who are interested in more conclusive research and analysis on VIX spikes, volatility and other subjects related to today’s events, the links below are an excellent place to start.
Related posts:
- The Biggest VIX Spike Ever: A Retrospective
- VIX Sets Some New Records, Suggesting Volatility Near Peak
- Highest Intraday VIX Readings
- Short-Term and Long-Term Implications of the 30% VIX Spike
- VIX Spike of 35% in Four Days Is Short-Term Buy Signal
- Lessons from the Post-2/27 VIX Price Action
- VIX Approaches Pre-2008 Record Highs
- VXO Chart from 1987-1988 and Explanation of VIX vs. VXO
- Volatility History Lesson: 1987
- Volatility During Crises
- Chart of the Week: VXV and Systemic Failure
- Euro Volatility and Risk
- The Evolution of European Equity Risk
- Forces Acting on the VIX
- A Conceptual Framework for Volatility Events
Disclosure(s): short VIX at time of writing

