Lessons From the Post-2/27 VIX Price Action
Following the 64% spike in the VIX on 2/27, there were many voices insisting that volatility was returning to the markets. For a week or two, they were occasionally correct, but I do not believe you can put a VIX spike in historical context until at least 20 trading days have passed since the spike. The 20th trading day, it turns out, was last Tuesday, so let’s do a post-mortem.
First, as I type this the VIX stands at 13.10, down almost 30% from the February 27th close of 18.31. While we did see some ‘echo volatility’ that briefly pushed the VIX into the 20s on the 4th and 11th day following the spike, for the last 14 trading days the VIX has only closed above 15 once, on March 29th, and even then it just barely managed to do so.
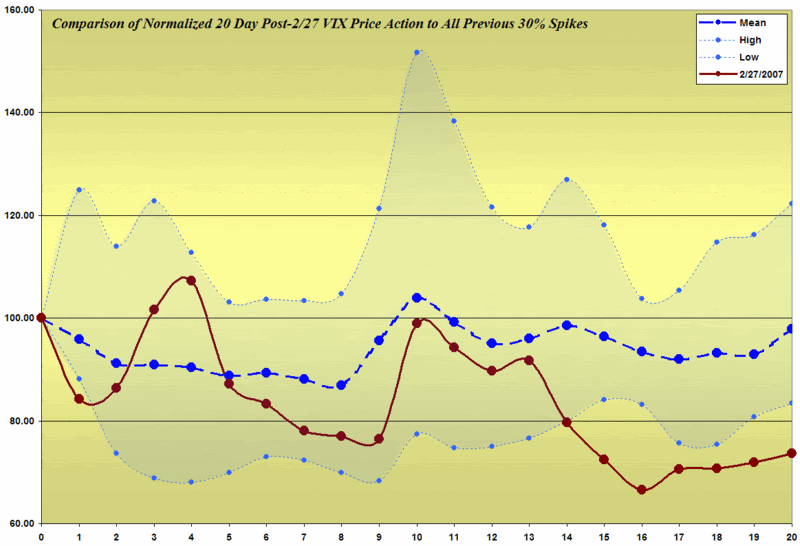
With an eye to historical context, I have been solidly in the mean-reversion camp since the 2/27 spike. On March 1, I posted some graphs showing what had happened to the VIX over the course of the subsequent 20 trading days in the eight previous instances following a 30% spike. In short, the conclusion was to expect considerable mean reversion in the first 10 days or so, with a couple of echo volatility spikes. The high probability trade was to expect mean reversion to win out over any subsequent volatility spikes and if you followed any of my suggested mean reversion VIX options trades, you undoubtedly did very well.
All of which brings us back to the present. How has the VIX price action following 2/27 compared to the VIX price action in previous 30% VIX spikes? The answer to this question, which can be discerned from the graph below of normalized closing prices, is that the two echo volatility spikes on day 4 and day 11 look eerily similar to the historical record. For the most part, the 2/27 VIX spike has been followed by very little volatility. In fact on only two days out of the 20 days subsequent to the spike did the VIX close at a level above the historical mean. I find it even more interesting that from days 14 through 20 (March 19–27), the VIX closed below the historical low on each day, down an aggregate 20-33%.
The next time you see a VIX spike, look for the high probability “fade the spike” play on the mean reversion side and be prepared to bet against the likely one or two instances of echo volatility. History is on your side.


1 comments:
In the event the graphic is truncated for some, you can find the original chart here
Post a Comment