After Two Months, Portfolio A1 Is 5% Ahead of the S&P 500
Now that has been two months since Portfolio A1 was launched, I feel that sufficient time has elapsed to begin taking a cursory look at some of the portfolio statistics.
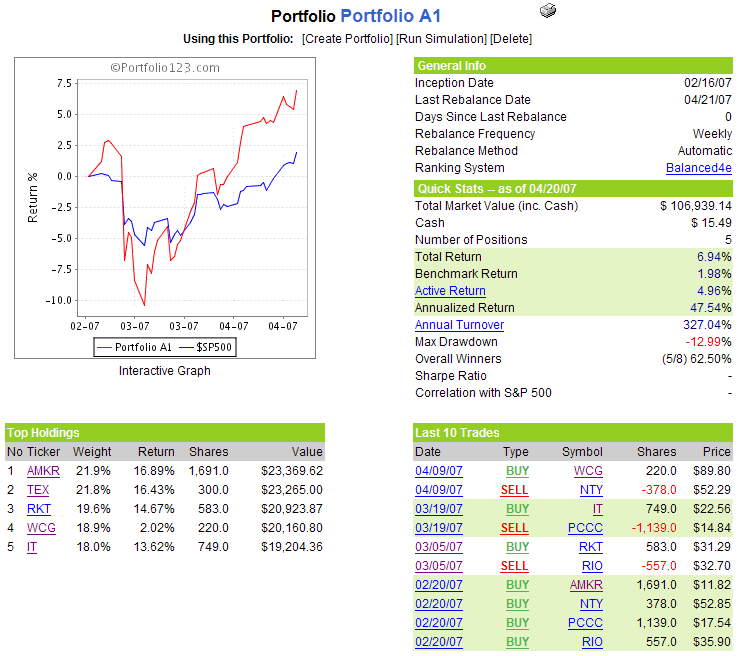
The first statistic that jumps out at me is annual turnover. While many may see a 327% annual turnover rate as high, this portfolio is designed to be actively traded, with the potential for turnover as high as 2000-3000% per year. So far, the system has culled three of the original five holdings. Of those three, only RIO has been a high performer since it was dropped from the portfolio. On the other hand, the post-sale performance of NTY and PCCC has been middling at best. So it appears that the system is doing a good job of cutting free losers – and I have no problem erring on the side of doing this too soon rather than too late.
In terms of the stocks that have been retained, four of the five current portfolio holdings are up at least 13% to date. The laggard, WCG, is up 2%, but it has only been two weeks since it was added to the portfolio. Again, this is just the type of performance I am looking for.
From a risk perspective, I look at maximum drawdown, which is the maximum peak to trough drop, regardless of time period. In the case of Portfolio A1, the 2/27 correction resulted in a 13% drawdown from the 2/26 high – a period during which the S&P 500 lost a little over 6%.
Though it is not included in the calculations on this graphic below, individual stock betas and correlations are an important component of portfolio risk. Four of the five stocks have betas in the 1.2 to 2.2 range; the fifth, AMKR, currently has a beta of about 5.0, which is partly responsible for why the current weighted average beta of the portfolio is 2.6. With the increased passage of time, I will look to the Sharpe Ratio as a means of measuring risk-adjusted returns.
Of course, total return and active return (defined as total return minus benchmark return, with the benchmark being the S&P 500 in this case) are two numbers that I keep a very close eye on. I am pleased to report that Portfolio A1’s return of 7% for the first two months is 5% better than the 2% return logged by the S&P 500.
There are no changes to the portfolio for the coming week.
A snapshot of the portfolio is as follows:


0 comments:
Post a Comment