Showing posts with label beta. Show all posts

Tuesday, February 19, 2008

Portfolio A1 Beats SPX by 15.5% in First Year, Helped by Commodity Theme
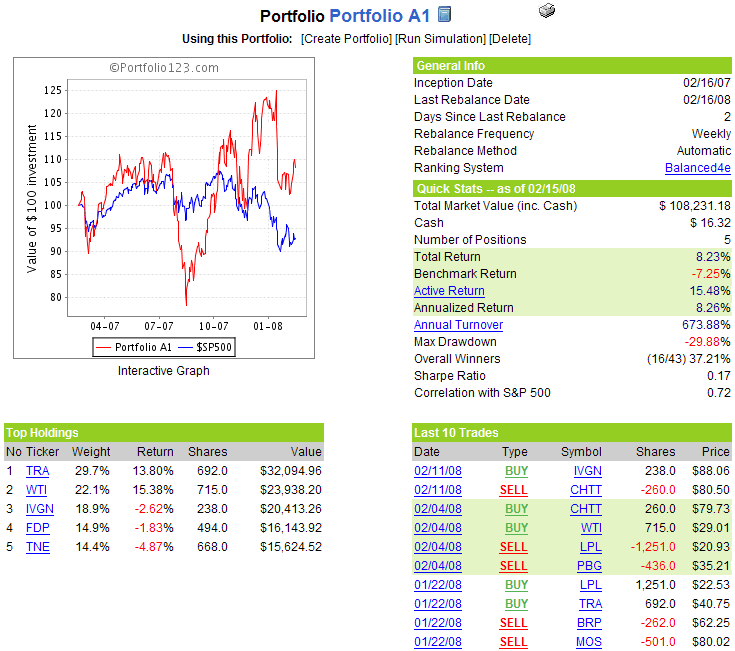
With two of the five focus positions in agriculture and energy, the commodities theme has been good to Portfolio A1. W&T Offshore (WTI), the oil and gas exploration and production company, is now up 15.4% in the two weeks it has been in the portfolio. Last week’s biggest winner was Terra Industries (TRA), which posted a 10% gain for the week, moving up with the red-hot nitrogen fertilizer space.

After one full year of performance (since the February 16, 2007 inception), Portfolio A1 officially goes in the books with a return of +8.23%, compared to a -7.25% move in the benchmark S&P 500 index over the same period, a net performance gain of 15.48% by the portfolio over the benchmark.

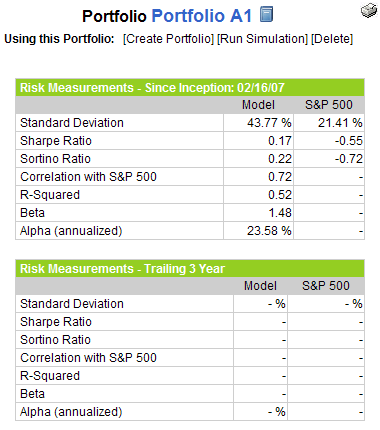
In terms of risk-adjusted return, the graphic to the right shows that Portfolio A1 has had an average beta of 1.48 and an impressive annualized alpha of 23.58% during the first year that the portfolio has been up and running.

In many respects, this portfolio was established to provided focused approach to "fishing for whales." That approach has been largely successful if a little inconsistent during the first year, landing such strong momentum stocks as of MOS, DRYS, TEX, PBR, RIO and others. Part of what makes finding so many big winners possible is a very high annual turnover. At 674%, this is clearly a trading portfolio, not a buy and hold approach. Losses are generally cut quickly and a new hook goes over the transom almost every week. I look forward to seeing how the portfolio fares in the second year, as we begin that year with what looks to be an extremely challenging investment environment.
Sunday, April 22, 2007

After Two Months, Portfolio A1 Is 5% Ahead of the S&P 500

Now that has been two months since Portfolio A1 was launched, I feel that sufficient time has elapsed to begin taking a cursory look at some of the portfolio statistics.

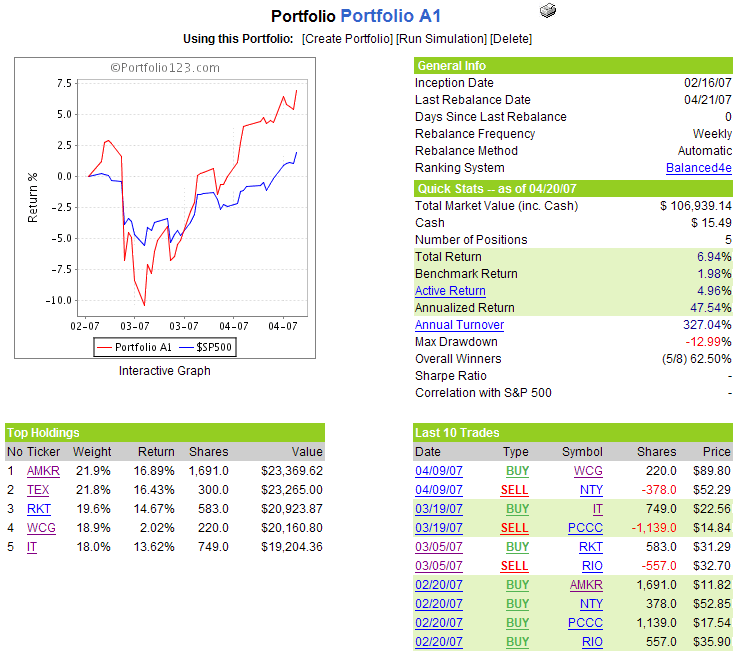
The first statistic that jumps out at me is annual turnover. While many may see a 327% annual turnover rate as high, this portfolio is designed to be actively traded, with the potential for turnover as high as 2000-3000% per year. So far, the system has culled three of the original five holdings. Of those three, only RIO has been a high performer since it was dropped from the portfolio. On the other hand, the post-sale performance of NTY and PCCC has been middling at best. So it appears that the system is doing a good job of cutting free losers – and I have no problem erring on the side of doing this too soon rather than too late.

In terms of the stocks that have been retained, four of the five current portfolio holdings are up at least 13% to date. The laggard, WCG, is up 2%, but it has only been two weeks since it was added to the portfolio. Again, this is just the type of performance I am looking for.

From a risk perspective, I look at maximum drawdown, which is the maximum peak to trough drop, regardless of time period. In the case of Portfolio A1, the 2/27 correction resulted in a 13% drawdown from the 2/26 high – a period during which the S&P 500 lost a little over 6%.

Though it is not included in the calculations on this graphic below, individual stock betas and correlations are an important component of portfolio risk. Four of the five stocks have betas in the 1.2 to 2.2 range; the fifth, AMKR, currently has a beta of about 5.0, which is partly responsible for why the current weighted average beta of the portfolio is 2.6. With the increased passage of time, I will look to the Sharpe Ratio as a means of measuring risk-adjusted returns.

Of course, total return and active return (defined as total return minus benchmark return, with the benchmark being the S&P 500 in this case) are two numbers that I keep a very close eye on. I am pleased to report that Portfolio A1’s return of 7% for the first two months is 5% better than the 2% return logged by the S&P 500.

There are no changes to the portfolio for the coming week.

A snapshot of the portfolio is as follows:

DISCLAIMER: "VIX®" is a trademark of Chicago Board Options Exchange, Incorporated. Chicago Board Options Exchange, Incorporated is not affiliated with this website or this website's owner's or operators. CBOE assumes no responsibility for the accuracy or completeness or any other aspect of any content posted on this website by its operator or any third party. All content on this site is provided for informational and entertainment purposes only and is not intended as advice to buy or sell any securities. Stocks are difficult to trade; options are even harder. When it comes to VIX derivatives, don't fall into the trap of thinking that just because you can ride a horse, you can ride an alligator. Please do your own homework and accept full responsibility for any investment decisions you make. No content on this site can be used for commercial purposes without the prior written permission of the author. Copyright © 2007-2023 Bill Luby. All rights reserved.
 
Web Analytics