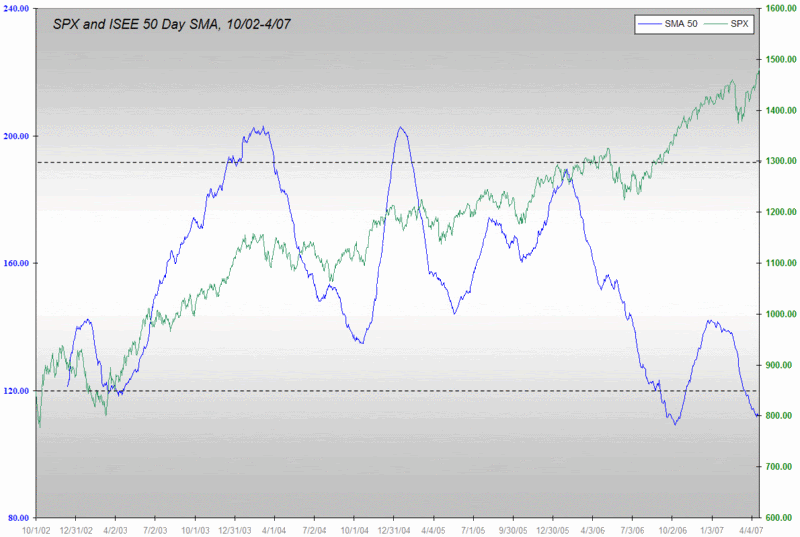
ISEE SMA 50 Double Bottom?
The nice thing about a 50 day simple moving average is that it is a lot easier to guess where it might be going than a number that starts with a blank slate each day. With the 50 day SMA, for instance, you can start by looking at the numbers that are going to be scrolling off of the 50 day time horizon used for the calculation, then assume they are going to be replaced numbers similar to the ones currently being printed and…voila: you can tell the future at least as well as the next guru.
In the case of the ISEE, it was not that difficult for me to gaze into the future on March 28th and discern that the ISEE 50 day SMA would be flashing a buy signal for the entire month of April, which is exactly what has happened. While it may be a little harder to predict the future right now, my educated guess is that April 16th is going to turn out to be the second half of a double bottom in the SMA 50, with the first half coming back in October.
One amazing statistic that partly explains why the SMA has trended so low in April is that since January, the ISEE has closed above the lifetime mean of 154 on only one day, when it posted a 156 back on February 16th. Today’s ISEE reading has been slowly trending up all day and sits at 139 of this writing. Looking at today’s numbers and data for the past week, it appears that investor sentiment is moving away from extreme bearishness and back toward the relative complacency that the VIX has hinted at.
Even with the possibility of a double bottom, the ISEE call to put ratio remains at a level that is historically associated with several months of continued bullish activity in the broader markets, as the chart below demonstrates. As more bears grow tired of fighting the trend, they could help to fuel the next leg up.


5 comments:
Original chart here
Bill. What happened to the VIX on Monday? I'll be looking for a post here!
Agustin:
The short answer is "I don't know!" -- but let me take some guesses at possible causes. Here are some quick thoughts for the moment (maybe a post will follow later in the day):
1) The Friday to Monday VIX problem is "a collision of the trading week and the calendar week" -- see Adam's comments for an explanation or check out a related thread at Elite Trader.
2) Volatility usually rises the week after options expiration. I discussed this phenomenon early on on the life of the blog, but should return to this theme for follow-up at some point.
3) My guess is that with a combination of VIX implied volatility having dropped dramatically during the past two weeks...and the the broader markets on an impressive winning streak, several indicators were flashing overbought signals and the VIX looked like cheap portfolio insurance once again.
Do you have any liquidity-based or other perspective on this?
Cheers,
-Bill
Not really, since my short-term liquidity indicators themselves depend(at least in part) on the VIX. There is talk, FYI, of a sharp fall in real estate prices in ... Spain.
Hasta luego,
Agustin
Overbought market. Very typical. Dumbmoney sees the Dow highs over the weekend and buys Monday as institutions and other smartmoney distribute. Implied volatility goes up as institutions dump shares on open market and bet using leverage that market will go down in near term. And, like usual, Tuesday is the big reversal day. I hate to say it, but I had a feeling over the weekend that it would play out like this.
Post a Comment