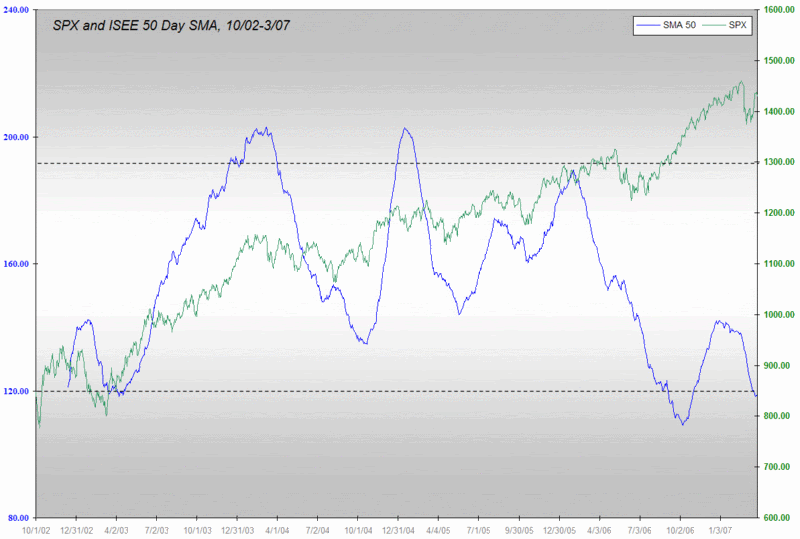
ISEE 50 Day SMA Is Bullish
A week ago, I posted about the ISEE and the predictive power of the 50 day SMA. I have since updated that chart to reflect a buy signal at 120 (-1.5 standard deviations from the mean) and sell signal at 192 (+1.5 standard deviations from the mean.)
After hitting a record low on March 8th and printing three record lows for the 10 day SMA two weeks ago, the ISEE’s 50 day SMA is now comfortably below the 120 buy level. Perhaps more importantly, with extremely high numbers due to scroll off the average in the next 10 days and relatively high numbers set to scroll off over the next month, it is a good bet that the 50 day SMA will be flashing a buy signal for most of April, if not the entire month.
If you put any faith in put to call ratios, then this is the time you want to get long, perhaps in a big way.


4 comments:
Hi Bill, your chart is cut off and we can't the recent data.
Sorry HC, but thanks for the heads up. It looks like I'm going to have to start adding links to all images the.
The original chart is here.
Do you know that acquiring Cheap Custom Research Paper Services online is convenient? Seek Legitimate Custom Research Paper services from a credible firm for all your Research Paper Writing Help Assignments.
Thanks for the information. I came across this site recently and found some useful stuff. You are doing a great job and I appreciate your effort.
Company formation in Dubai | Trade license in Dubai
Post a Comment