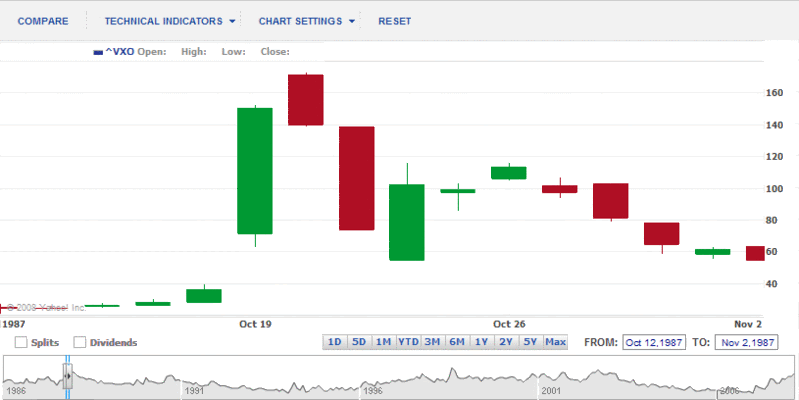
Volatility History Lesson: 1987
To summarize some history I laid out in Meet the Spikers, the VIX was officially launched on 4/1/93. At that time the method used for calculating the VIX was based on 8 S&P 100 (OEX) calls and puts with an average time to expiration of 30 days. On 9/22/03, the VIX calculation methodology was revised to include S&P 500 (SPX) options for all near term at-the-money SPX puts and calls and out-of-the-money puts and calls (deep-in-the-money options were excluded.)
At the time of the methodology switch from OEX options to SPX options, the CBOE created the VXO to provide continuity with the historical method of calculating the "old VIX" prior to 9/22/03.
The bottom line is on Black Monday (October 19, 1987), it was still 5 ½ years before a volatility index would first appear. The CBOE, however, was able to go back and reverse engineer the volatility data for 1987, using the OEX options methodology (i.e., the VXO or pre-2003 VIX.) The results are attached below. Keep in mind that given the slight difference in methodology, the VXO has historically registered at levels of about 5% higher than the VIX.


3 comments:
The description of the methodology to calculate the VIX and of its revision to include SPX options on 9/22/03 is clear. The bottom portion of your graph illustrates the relative levels in the VIX between the years 1986 and 2001 and the large variations in the VIX on and after Black Monday on October 19, 1987. No numerical indicators are outlined on this graph to measure the variations in the VIX. What source illustrates the numerical variations in the VIX since 1986 and/or for trading before and after Black Monday in 1987?
Bill,
but what would be the lesson to be learned here ?
I don't think that everybody is completely aware what a VIX (or VXO) of 172.79 (VXO intraday high on October 20, 1987, representing an annualized volatility of 172.79%) would mean:
1) The market expects that with a 68% likelihood (one standard deviation) the 30-day change in the S&P 500 will be within 49.88% (172.79 divided by the square root of 12 (calendar month)).
2) To achieve an annual (252 trading days) realized (!, not implied) volatility of 172.79% the following (exemplary) day to day fluctuations concerning the S&P 500 (close to close) would be necessary:
example 1) 4 days with +/-50% and 248 with +/-6% or
example 2) 252 days with +/-10.80% each or
example 3) 10 days with +/-30%, 15 days with +/-20%, 30 days with +/-10% and 197 days with +/-5%
The same would apply accordingly to a 30 calendar day period. That would in deed represent an interesting year and/or calendar month !?
According to my own statistics and beginning January 1, 1986, the highest annual (252 trading days) realized volatility has been 35.00% (realized variance of 1225.13), measured on July 29, 1988, and the highest 30-day realized volatility has been 28.14%, measured on November 12, 1987 (annualized realized variance over the last 22 trading days = 9.501,74, with volatility the square root of variance = 97.48%, divided by the square root of 12 (calendar month) = 28.14%).
These figures have been calculated for every trading day since January 1, 1986, taking into account the previous 22 (252) trading days on a rolling basis.
So a VIX (VXO) at or around 172 would either (if the market's expectation would in fact become reality) let black Monday and the then following trading period look like "negligible" in comparison to the 30 calendar days (year) following a VIX (VXO) of at or around 172, or it would represent a once in a lifetime opportunity to sell implied volatility with appropriate trading vehicles.
Best regards
Frank
Anon,
You can get the full data set of historical prices going back to 1/2/86 for VXO from Yahoo Finance here or the CBOE (always the preferred source) here
Frank,
It looks like I am going to have to give you a guest column in the blog. I always appreciate your comments and what you have added above is a superb enhancement to my graph, which was more of a visual one-liner than filled with substance.
Nice work -- and thanks for extrapolating the meaning of volatility to smaller 4, 10, 15 etc. day chunks.
Cheers,
-Bill
Post a Comment