Showing posts with label Black Monday. Show all posts

Monday, May 10, 2010

New Record for One Day Fall in the VIX

The VIX spikes up, but it rarely spikes down, today’s action notwithstanding. In fact, today’s 29.6% decline in the VIX is the largest single day decline in the 17 year history of the VIX and in the 20 years of reconstructed VIX data.

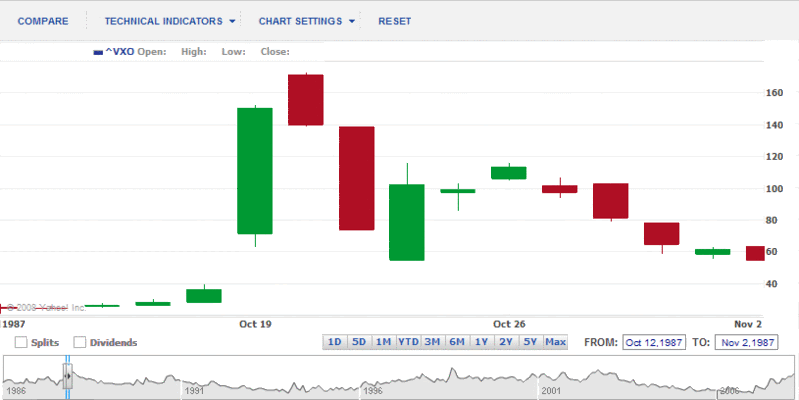
Using reconstructed data for VXO, which utilizes the original calculation methodology for the VIX, I find only one instance in the last 24 years in which the VIX declined more than it did today: Wednesday, October 21, 1987, two days after Black Monday, when the (original calculation) VIX fell 47% from 140 to just under 74. [For background information, try VXO Chart from 1987-1988 and Explanation of VIX vs. VXO for more information on VXO]

In thinking about the relative abundance of VIX spikes and scarcity of dramatic VIX drops over the course of history, I sometimes like to invoke the metaphor of a medieval castle. A dragon periodically appears and terrorizes the castle and its inhabitants, sometimes visible for only a fleeting moment and other times hanging around for an uncomfortably long period of time. Every time the dragon appears, the citizens panic. One day a knight goes out into the forest and slays the dragon, returning with the head of the beast. The citizens rejoice and relax for a moment, until it occurs to them that the forest may be filled with dozens of dragons.

So…one dead dragon does not mean the crisis has passed.

Getting back to statistics, the VIX has fallen 20% in one day on eight previous instances. On average, looking forward one day, week, month, quarter, etc., stocks have tended to underperform somewhat following a sharp drop in the VIX. The last two instances of 20% drops, from October 2008, have now skewed the data so that aggregate performance looks quite dreadful. Still, one can argue that in the first three of the eight instances (1993, 1994 and 2006), stocks outperformed historical averages when looking at least two months out. All things considered, small sample size and all, I would have to conclude that today’s action translates to a mildly bearish outlook going forward – at least based on historical data.

For more on related subjects, readers are encouraged to check out:

Disclosure(s): short VIX at time of writing

Monday, May 18, 2009

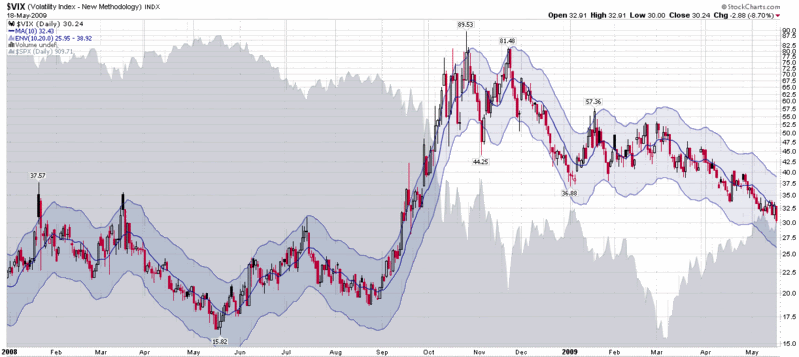
VIX Touches 30.00, Settles at 30.24

Today the VIX stood at 30.02 as the NYSE regular session closed at 4:00 p.m. ET, then ticked down to 30.00 just after the close and inched back up to 30.24 by the time the index trading session closed at 4:15 p.m.

The close was the lowest for the VIX since September 12th, which was the Friday just before Lehman Brothers declared bankruptcy.

All told, the VIX has now closed above the 30 level for 170 consecutive trading days. This far surpasses the previous record of 49 days in a row from 1998 as well as the 47 day string of 30+ closes from 2002.

About the only useful historical comparison for extended volatility comes from 1987-1988, where data reconstructed for the VXO (‘original VIX’ calculations) show that the ‘original VIX’ would have remained above the 30 level for 86 consecutive days – about half of the current period of heightened volatility.

To put the 30 level in the VIX in a different perspective, it may be helpful to consider that from March 2003 to August 2007, the VIX did not close above 30 at all. From April 2003 to August 2007, the VIX failed to even reach the 30 level on an intraday basis.

Finally, just for grins, 2001 is the year with the current highest low water mark for the VIX for an entire calendar year. The low VIX for 2001? Just 18.74.

I will have some thoughts on where the VIX might range for the balance of 2009 tomorrow.

In the interim, for more on volatility during the 1987-88 period, check out The Persistence of Volatility and Volatility History Lesson: 1987. For more on the VXO, including how the index would have acted during in the wake of Black Monday, try VXO Chart from 1987-1988 and Explanation of VIX vs. VXO.

[source: StockCharts]

Monday, September 29, 2008

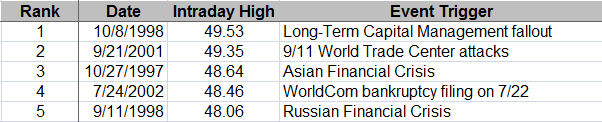
Top Five VIX Spikes

With the VIX spiking up to 39.59 just a moment ago, I thought it might be instructive to recap the top five VIX readings since 1990, the first year for which the CBOE has calculated VIX historical data:

Note that these readings are all dwarfed by the high of over 170 recorded by the VXO (‘old VIX’) on Black Monday 1987.

Monday, March 17, 2008

Volatility History Lesson: 1987

To summarize some history I laid out in Meet the Spikers, the VIX was officially launched on 4/1/93. At that time the method used for calculating the VIX was based on 8 S&P 100 (OEX) calls and puts with an average time to expiration of 30 days. On 9/22/03, the VIX calculation methodology was revised to include S&P 500 (SPX) options for all near term at-the-money SPX puts and calls and out-of-the-money puts and calls (deep-in-the-money options were excluded.)

At the time of the methodology switch from OEX options to SPX options, the CBOE created the VXO to provide continuity with the historical method of calculating the "old VIX" prior to 9/22/03.

The bottom line is on Black Monday (October 19, 1987), it was still 5 ½ years before a volatility index would first appear. The CBOE, however, was able to go back and reverse engineer the volatility data for 1987, using the OEX options methodology (i.e., the VXO or pre-2003 VIX.) The results are attached below. Keep in mind that given the slight difference in methodology, the VXO has historically registered at levels of about 5% higher than the VIX.

DISCLAIMER: "VIX®" is a trademark of Chicago Board Options Exchange, Incorporated. Chicago Board Options Exchange, Incorporated is not affiliated with this website or this website's owner's or operators. CBOE assumes no responsibility for the accuracy or completeness or any other aspect of any content posted on this website by its operator or any third party. All content on this site is provided for informational and entertainment purposes only and is not intended as advice to buy or sell any securities. Stocks are difficult to trade; options are even harder. When it comes to VIX derivatives, don't fall into the trap of thinking that just because you can ride a horse, you can ride an alligator. Please do your own homework and accept full responsibility for any investment decisions you make. No content on this site can be used for commercial purposes without the prior written permission of the author. Copyright © 2007-2023 Bill Luby. All rights reserved.
 
Web Analytics