Showing posts with label 1994. Show all posts

Tuesday, June 18, 2013

VIX and SPX During the 1994 Interest Rate Hike Cycle

With yesterday’s The VIX and the Pre-FOMC + Post-FOMC Trades post in the books, it occurred to me that my reference to the series of interest rate hikes in 1994 probably stretches back before the memory banks of the current generation of investors. So with all the anxiety about Fed tapering and ultimately ending quantitative easing, I thought this might be a good time to review what happened to stocks and volatility when the Fed embarked upon a series of interest rate hikes that took the financial community by surprise.

To set the context, the 1990s started out with a recession that coincided with the first Gulf War and a corresponding sharp rise in oil prices. The Fed had been gradually lowering interest rates from 1989 – 1992 and this helped to create an environment that favored a recovery, but this recovery took some time to gain traction and did not get going until 1991. The stock market fared better than the economy during this period; after a down year in 1990, stocks rallied to post gains in 1991, 1992 and 1993. After a strong January for stocks, 1994 appeared to be on a similar path to success.

It was at this point that Federal Reserve Chairman Alan Greenspan decided to remove the proverbial punch bowl before the party got out of hand and on February 4, 1994, the Fed surprised the markets by announcing a 0.25% increase in the federal funds rate. By the time 1994 was over, the Fed had raised interest rates on six different occasions. As the chart below shows, the first three raises were 0.25% increases in the federal funds rate, but the incremental size of the raises increased to 0.50% and eventually 0.75% later in the year and were supplemented by increases in the federal discount rate, which also grew from 0.50% to 0.75%. By the time 1994 was in the books, the federal funds rate had jumped from 3.00% to 5.50% and the federal discount rate had risen from 3.00% to 4.75%. (The rate hike cycle finally ended on February 1, 1995, when the Fed raised the federal funds rate to 6.00% and the federal discount rate to 5.25%.)

Keep in mind that Alan Greenspan did not believe in signaling the Fed’s intentions in those days; on the contrary, he was a master of obfuscation and his cryptic and often ambiguous language typically kept investors in the dark about his intentions. For this reason, it was difficult for the markets to anticipate the Fed’s next move and investors we not necessarily prepared for subsequent interest rate hikes.

How did the financial markets respond to what amounted to almost a doubling of the federal funds rate and an increase of more than 50% in the federal discount rate? With a lot less volatility than one might imagine. The average closing value of the VIX was 13.93 in 1994, little different than the 13.90 average for the VIX in 2013. While the VIX did spike all the way up to 28.30 on April 4th, the VIX only closed above 20.00 on two days during the entire year! The S&P 500 index ended the year with a small loss (a small gain if dividends were to be included in the calculations), but roared back with gains of 34%, 20%, 31%, 27% and 20% in the subsequent five years.

[source(s): StockCharts.com, Federal Reserve Bank of New York, VIX and More]

The series of rate hikes did dramatically change the yield curve, as the chart below illustrates. The more dramatic moves were at the front end of the terms structure, with the curve essentially flat from two years through thirty years by the end of 1994.
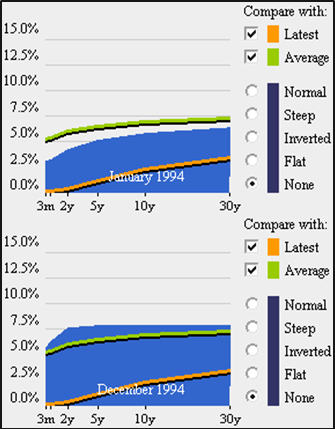
[source(s): Wall Street Journal / SmartMoney]

So while Robin Harding’s Fed Likely to Signal Tapering Move is Close article in the Financial Times yesterday (and his subsequent tweet, “The Fed does not leak anything to any journalist to steer markets - especially during blackout”) may have given investors an opportunity for a dress rehearsal for the ultimate tapering, the historical record from 1994 suggests that tapering fears may be exaggerating how the QE end game will ultimately play out.

Related posts:

Disclosure(s): none

Monday, June 17, 2013

The VIX and the Pre-FOMC + Post-FOMC Trades

Back in December 2008, in VIX Trends Around FOMC Announcement Days, I posted a chart of the average movements in the VIX in the ten trading day leading up to and following “Fed Days,” otherwise known as days in which the Federal Open Market Committee (FOMC) makes its policy statement announcement. Several long-time readers who recall that chart – and an earlier incarnation from VIX Price Movement Around FOMC Meetings – have recently asked for an updated version. With all eyes on the Fed’s statement and Ben Bernanke’s press conference on Wednesday, this seems like a good time to revisit how the VIX moves in the days leading up to and following FOMC announcements.

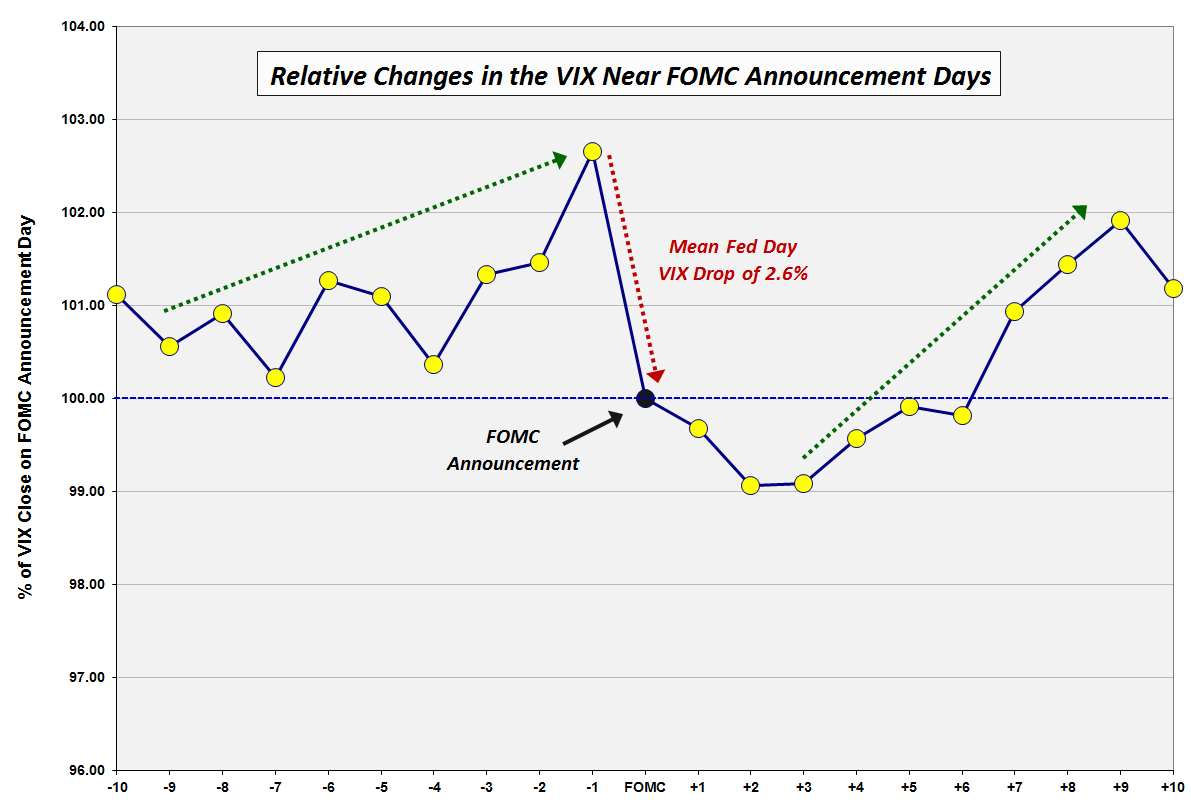
In the chart below, I have normalized VIX data going back to 1990 to make it easy to compare the mean daily changes in the VIX in the ten trading days preceding FOMC policy statement announcements as well as ten trading days following those announcements. The quick takeaway is that the data from the last five years has been consistent with the data as of 2008. There are still three dominant features in this chart:

  1. a pre-FOMC VIX ramp in which the VIX tends to move up sharply in the three days leading up to the FOMC announcement and trend up more gradually 1-2 weeks in advance of the announcement
  2. a sharp decline in the VIX averaging about 2.6% on the day of the FOMC announcement, with a gradual decline in the VIX of another 1.0% or so in the two days following the announcement
  3. a sharp rebound in the VIX that starts three days after the FOMC announcement and persists until nine trading days after the announcement

Over the course of the past five years, the pre-announcement ramp in the VIX has been steeper during the three days prior to the announcement and more gradual in the week or so prior to that period. Also, recent history has seen the post-announcement decline in the VIX extending two additional days to now span four days following the announcement.

Of course there is no reason to expect that patterns which have persisted for the past 33 years to magically reappear for each FOMC announcement going forward, but I do believe that the historical pattern does say something about human nature, uncertainty and perceptions of risk.

It is worth noting that the biggest one-day jump in the VIX on a Fed day dates from February 4, 1994, when Federal Reserve Chairman Alan Greenspan surprised the markets by announcing a 0.25% increase in the federal funds rate, helping to lift the VIX 41.9% on that day. For comparison purposes, the next largest Fed day VIX increase was a 15.1% gain on March 15, 2011. While another VIX pop may be in the cards, history says there is a 72% chance the VIX will decline on Wednesday and that the decline should average about 2.6% or about 0.44 based on the current level of the VIX.

What is the trade here? While many will undoubtedly try to guess the direction of Wednesday’s move, the three other trades with a historical bias include:

  1. an increase in the VIX in advance of Wednesday’s announcement
  2. a continuation of any decline in the VIX from Thursday to Monday
  3. a new uptrend in the VIX beginning on Monday or Tuesday and running through the beginning of July.

[source(s): CBOE, Yahoo, VIX and More]

Related posts:

Disclosure(s): none

Tuesday, October 21, 2008

VIX Drops 20% in One Day…Again

Sometimes a big move in the VIX is significant and sometimes it is a lot harder to interpret. On the surface, yesterday’s 24.7% drop in the VIX – the second largest one day move down in percentage terms – appears to fall in the latter category.

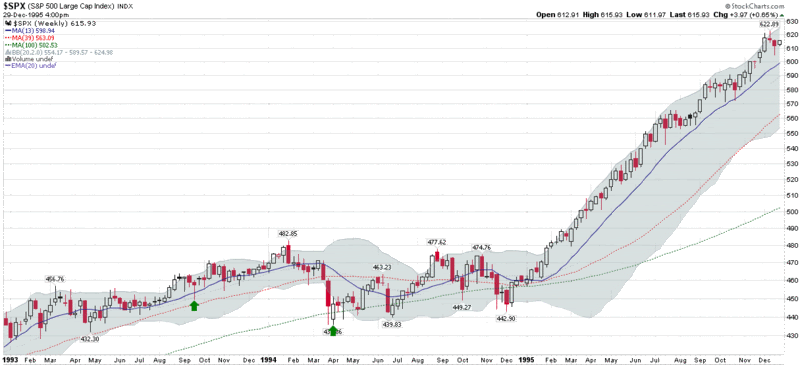
From 1990 through 2005 the VIX fell 20% on only two trading days: once in 1993 and once again in 1994 (see green arrows in top graphic). Each instance signaled a bottom and about a three week bounce. The markets then moved up sharply in 1995, but it is a large stretch to say that the VIX offered any signal about a move that was at least nine months away.

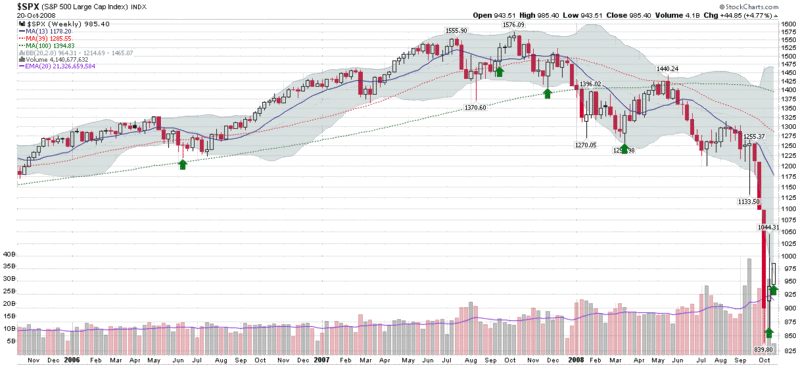
After an 11 year drought, an uptick in volatility brought the 20% drop back into vogue in the middle of 2006 and including yesterday, there are now six such instances in the past two years and four months. The bottom chart also marks these 20% drops with green arrows, which once again tend to signal bounces of no more than about three weeks.

In general, I do not consider a 20% one day drop in the VIX to be particularly significant. In most cases this is merely a statistical quirk which results from the typical mean reversion process that appears while volatility retraces the path of a previous upward VIX spike. In such instances, the initial VIX spike is the more noteworthy event.

Now for one of my favorite phrases: “But this time it’s different!”

In all fairness, I can make a slightly different case for the current environment in that the eight week VIX spike that topped out at 81.17 was so severe and persistent that it is not so much the extreme fear that is important from a trading perspective, but an indication that a diminution of that fear is taking place. In many places in this country, people have not been this fearful in 75 years, so any indication that fear may be starting to reverse direction is indeed significant.

Let’s see where we are in three weeks…

[source: StockCharts]

Monday, May 21, 2007

Larry McMillan on a Positively Correlated VIX and SPX

Thanks to the CFE’s Futures in Volatility newsletter, I have a fairly good idea what Larry McMillan is thinking about vis-à-vis a positively correlated VIX and SPX. The May 21, 2007 issue of Futures in Volatility just arrived in my mailbox a few minutes ago and in it McMillan makes the following observations:

“The last few weeks have seen a slow but steady rise in VIX (and in most VIX futures), even though the broad market, as measured by the S&P 500 Index, is rising in price. This is not a phenomenon that is seen too often, but it is not completely unprecedented. Occasionally, one sees a day or two in which VIX rises while the broad market rises, but it is much more unusual to see a trend of that sort. The current trend has lasted one month, but back in the 1990s, there were periods when VIX rose for months while the S&P 500 Index rose as well. If one recalls, VIX was near 10 in late 1994. But during the bull market of the 1990s, VIX rose to the point where it was routinely between 25 and 30 in 1998 and 1999. Yet, during that time, the S&P 500 Index also rose quite strongly, as those were the banner years of that bull market.


In the last month, futures prices have reacted accordingly, although their pricing curve is in a state that has not yet been seen in the 3-year history of VIX futures trading. Most of the VIX futures, Variance futures, and VIX options have followed VIX higher in the last month. VIX products have increased in price much across the board: November 2007 and February 2008 VIX futures are now slightly above 15. Even the August 2007 VIX futures are nearly 15. Does this mean that volatility traders are looking for higher volatility later this year? It certainly seems that way. What is a bit unusual is that there is not really much of a spread between the longer-term contracts…Looking back over the history of VIX futures trading, there are only two other occurrences of similar tightly-packed groupings of VIX futures prices. Those occurred in April and May 2005, and June and July 2006, both of which were times when the market had just fallen and was beginning to rally, so the futures were transitioning between “bearish” and “bullish” shapes. That is not the case now. This is the first time we have seen this construct while the market is rallying. In all likelihood, the futures are indicating that the market is going to become more volatile, regardless of the direction of the S&P 500 Index. It appears that traders expect volatility to be more in line with historical norms (the long-term historical volatility of the S&P 500 Index is approximately 15%).”

McMillan’s remarks dovetail nicely with my thinking in “VIX Futures: The One Picture to Remember” (see the comments, in particular.) Still, I am not yet prepared to make a call on the likelihood of increasing volatility or the direction of the SPX. As far as I’m concerned, the record highs and continued upside momentum in the SPX outweigh any signs of technical weakness or a breakdown in investor sentiment. I will have more to add to my May 4th “Predictive Value of SPX and VIX Correlation: First Pass” post in the near future. This time around I will offer only two words of advice: trailing stops.

Friday, April 20, 2007

The SPX and the VIX Revisited

Several readers have inquired about whether the markets can continue to make new highs if the VIX is well above its all-time low. My answer is a resounding “Absolutely!” Frankly, I would expect new highs in the broad market indices to only rarely correspond to new lows in the VIX.

I present my thinking below, but before I get into the details, let me pose a question. Assume I tell you that I have had a glimpse of the future and can guarantee that in 2050 the SPX will be trading at 100,000. Now I ask you to guess what the VIX will be when the SPX hits that milestone. What did you guess? 10? 11? My guess would probably be 18 or 19, as the mean daily close of the VIX since 1990 currently stands at 18.95. For the record, that 100,000 number is not all that outrageous either, as it represents 'only' a 10.1% CAGR, which is consistent with historical rates of return.

The big problem here, as I discussed in some detail in “The SPX:VIX Relationship” is that we are attempting to compare one number that trends about 10% a year over the long-term with another value that oscillates around a mean of about 19.

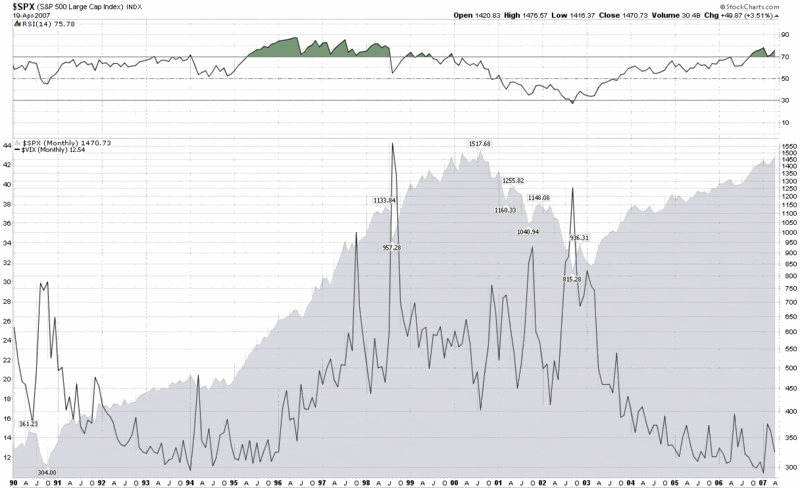
Let me pull up a monthly chart of the SPX and the VIX going back to 1990 to illustrate my point (click for a larger image; also feel free to disable the Snap preview function with a click on the upper right hand corner of any previewed image if you so desire):


Look closely at the period from October 1994 through March 2000, which, of course, was a raging bull market in which the SPX increased by a multiple of about 4.5x and made hundreds of new all-time highs. What many may not realize is that the VIX was moving up steadily during this period as well, going from the 12-14 range to the mid-20s. In fact, one should expect that given the oscillating nature of the VIX, there will be many bullish periods where the VIX actually goes sideways or rises. Only during extreme bullish complacency should we expect to see VIX readings in the 11-12 range and sub-10 may turn out to be a once a decade phenomenon. Said another way: there is a fairly strong possibility we will not see a sub-8 VIX this century, yet by the end of the century there is a good chance that the SPX will have something like 39 digits in it.

One other factor to consider about the current state of the VIX and market indices is echo volatility, which I have spoken about at length here in the past. While some who may be buying stocks may feel like the big volatility spike is behind us, others, like my dog, are firm believers in volatility clusters – and with good reason.

In summary, time horizons are important, but it is even more important to know when you are comparing trending numbers with oscillating ones. For one potential resolution to the SPX-VIX conundrum, you might wish to take a look at my previous posts on the SPX:VIX ratio.

Sunday, March 4, 2007

VWSI at -10

With the VIX Weekly Sentiment Indicator (VWSI) ending the week at -10 for the first time since 9/11, the prognosis for the VIX over the next month or so is as bearish as it has ever been.

The current extreme readings in the VWSI have only been approached on three previous weeks since 1990:

  • Following 9/11
  • In the wake of the Asian Financial Crisis and a 554 point decline in the Dow on 10/27/97
  • On the heels of a second Fed rate hike in consecutive months in March 1994, after a period of five years without any Fed rate hikes

In each of the three instances above, the broader markets were characterized by considerable turbulence and uncertainty for at least a year following the crisis.

As far as the VIX is concerned, if the history above is any guide, expect a sharp reversion to the mean. The three previous -10 VWSI readings resulted in the following changes in the VIX:

  • 3 days: mean of -23% (-17%, -24%, -27%)
  • 5 days: mean of -32% (-27%, -33%, -36%)
  • 10 days: mean of -33% (-18%, -38%, -42%)
  • 20 days: mean of -43% (-37%, -46%, -47%)

As is the case with most VIX mean-reversion plays, most of the gains in these instances were limited to the first 20 trading days.

Keeping in mind the history above, there are many possible investment approaches if one expects history to repeat itself. Being short volatility or short the VIX should be a central portion of that strategy. Neutral calendar spreads are a relatively conservative approach; put back spreads would be more appropriate for an aggressive investor. Those wishing to strictly limit risk should probably also be looking at iron butterfly and iron condor strategies.

Finally, I would be remiss if I didn’t add that in periods of elevated volatility even more so than in more ‘normal’ markets, one should always plan exits before placing any trade and use stops wisely. Better yet, if you are not used to trading options, this is not the time to start experimenting.

(Note that in the above temperature gauge, the "bullish" and "bearish" labels apply to the VIX, not to the broader markets, which are usually negatively correlated with the VIX.)

Tuesday, February 27, 2007

One Day 30% (!) Spikes in the VIX

Nobody has asked yet, but I might as well save those who are contemplating the question a few keystrokes.

Since the VIX was officially rolled out in 1993, there have been only 4 days in which it spiked up 30% or more. Turn the clock back to 1990 and you find a total of 8 days.

For those who might be interested, the mean reversion expectations following a +30% move are very similar to that of +20% days, which I weighed in on this morning. The data sample size is small enough to not be statistically significant, but still, in the 3, 5 and 10 days following the VIX spikes, 6/8, 7/8 and 5/8 of the VIX moves had reversed. The mean retracements were 9% and 11% over the 3 and 5 day period, but 10 days out, the mean move had continued upward 4%, owing largely to the strength of one subsequent 52% spike in the VIX.

The VIX has not made a 40% move to the up side since February 2, 1994, when the Fed’s decision to raise interest rates sent shock waves through the markets.

Monday, February 26, 2007

“Let’s see if you bastards can do 90!”

About a month ago, I remarked on some comments from Doug Kass about how the markets looked a lot like 1994, which was a decidedly down year for equities. Now Bernie Schaeffer tells us that the WABAC machine (not to be confused with the highly entertaining internet archives ‘wayback machine’) should actually be set to 1995, not 1994.

The difference, of course, is substantial. In 1995, we saw the beginning of a glorious bull run that lasted through until early 2000. Those who loaded up on long positions in 1994 probably had a substantial hole to dig out of before they could enjoy the fruits of the 1995 bull – if they didn’t give up entirely in the interim.

In “Market Parallels with 1995,” Schaeffer makes the case for parallels with the beginning of the 1995 bull as follows:

“Joseph Keating, chief investment strategist at First American Asset Management, recently pointed out in an article that the SPX's price-to-earnings (P/E) ratio fell to 17 as of the third quarter of 2006 - lowest since mid-1995. Meanwhile, the SPX has now gone 221 days without a two-percent correction. This compares to the 223-day streak experienced in 1995.

Furthermore, we find the market in another in a low-volatility environment, as the CBOE Market Volatility Index (VXO) currently hovers around levels similar to those we saw in 1995. “

Personally, I think it looks more like 2017 than anything else. If forced to choose to match my outlook with one year over the other, I’d pick 1994 over 1995, but what do I know, I’m just living in my own little VIX-centric universe…

Thursday, January 25, 2007

1994 All Over Again?

Apropos of the recent discussion about previous periods of low volatility, Doug Kass at TSCM has an article, Bears Locate a Template for a Crash, devoted to the many similarities between early 2007 and early 1994.

Kass succinctly recalls what happened in 1994:

"A two-month drop of nearly 10% in the S&P 500 Index began at the end of January 1994. The emerging markets collapsed -- Hong Kong's market fell by a third and Mexico by an even greater amount. The bond market got schmeissed -- by year-end, the 10-year U.S. note had fallen 20 points, correcting the entire gain of the previous three years. Finally, the VIX fell back to 1990 levels, climbing from 9 to 24 in only two months..."
Today's 13% rise in the VIX does not necessarily herald the beginning of another sharp shock, but it should be enough to make the bulls a little more skittish for awhile.

Wednesday, January 24, 2007

A History of Sub-10 VIX Closes

Today the CBOE Volatility Index closed under 10.00 for just the ninth time since it was launched in 1993. Three questions immediately arise from this fact:

  1. What is the history of sub-10 closes?
  2. What does the current one mean?
  3. How might the current situation be tradeable?

Today we will start with the first question, touch on the second one, and push the third one off until tomorrow morning.

The 1993-94 Lows

Looking at the history books, prior to 2006, the VIX closed below 10.00 on five occasions: four consecutive days in late December 1993; and once in late January 1994. In all instances, the VIX rebounded sharply higher 3, 5, 10, 20 and 50 days later. For the record, the SPX was little changed in the 3/5/10/20/50 day time from the four consecutive days in December 1993, but did sell off following the January 1994 low.

The details are as follows:

Sub-10 VIX #1-4) On 12/23-24/1993 and 12/27-28/1993 the VIX closed at 9.31, 9.48, 9.70 and 9.82, respectively. For comparison purposes, the SPX closed in the range of 467-471 during the same period. Three days later, the VIX was already up 6%, 10%, 10% and 19%. By the fifth trading day, those same gains had been extended to 15%, 23%, 30% and 21% from those closes. Ten trading days from the VIX lows, the VIX was up 21%,16%, 11% and 15%, while the SPX was anywhere between flat to up 1.0%. Twenty trading days from the lows, the VIX still showed cumulative gains of 20%, 17%, 20% and 16% from the original lows, with the SPX flat to up 1.6%. The more dramatic action came in the next 30 trading days, as 50 days from the original lows, the VIX was trading between 14.41 and 16.23, for cumulative gains of 72%, 50%, 57% and 47%. By the 50 day mark, the SPX had drifted down slightly, between -0.6% and -1.0% of the corresponding December close. The bottom line: the VIX was a good long at these lows and the SPX did not move for the next 50 trading days. In fact, there was no substantial drop (single day or cumulative) in the SPX until February 1994 and the SPX drifted sideways until the end of March 1994.

Sub-10 VIX #5) About a month later, on 1/28/1994, the VIX closed at 9.94, the last time it would close that low until November 2006. Looking at the same 3/5/10/20/50 day trading frame, the VIX rallied from that low to 10.61, 15.25, 14.46, 14.87 and 16.62, representing gains of 7%, 53%, 45%, 50% and 67% from the low. This time there was movement in the SPX, as it posted moves of +0.7%, -2.3%, -1.8%, -2.4% and -6.5% over the corresponding 3, 5, 10, 20 and 50 trading day periods. The big move behind the SPX numbers was a -2.3% drop in the SPX on the 5th trading day following the 1/28 low. This also happens to be the 28th, 29th, 30th and 31st trading day following the four consecutive December 1993 VIX lows. For the next 65 trading days, the SPX slid steadily lower, from 469 to 460, before dropping another 21 points over the course of four trading days.


A New Era in 2006-07?

Sub-10 VIX #6-7) On 11/20-21/2006, the VIX closed below 10.00 for the first time in a dozen years. While the 50 day ROI calculations are still two weeks away, the 3/5/10/20 day analysis shows gains of 8%, 17%, 13% and 3% for the first date and 24%, 9%, 14% and 4% for the second date. These VIX lows occurred in the fourth month of what is now a continuing six month upward move in the SPX, which has it currently 2.7% and 2.8% above the corresponding November values. There was a -1.4% drop in the SPX three trading days after one close and four trading days after the other close, on 11/27/06. I would not consider this drop to be noteworthy, however, as it was fully retraced over the course of the next two trading days and indeed the SPX has moved decisively higher over the past two months.

Sub-10 VIX #8) On 12/14/2006, the VIX once again closed below the psychologically significant 10.00 barrier. In the subsequent 3/5/10/20 day period, the VIX has had relatively tepid gains of 3%, 6%, 16% and 6%. The SPX has been drifting sideways for most of this period, but with today’s strong move now stands 1.0% above the 12/14 close.


Interpretation of the Current (#9) Sub-10 Close

To say that the VIX has closed under the 10.00 mark nine times is to stretch the truth a bit, as some of these daily closes might better be considered as multiple instances of two short-term volatility lulls in late 1993 to early 1994 and late 2006 to early 2007. Each of these two periods had a multiple days of consecutive sub-10 closes followed by an “echo low” approximately one month later. So far, today’s sub-10 close can only be considered another echo low, until we see how the balance of the current VIX lull plays out.

This categorization has important statistical implications. Is it two clusters of lows or nine independent data points? Either way, the small sample size has little statistical validity, but it is harder still to draw conclusions from two data points scattered over the course of 15 years.

Still, the data reflect that for each of the previous sub-10 closes, the VIX was higher 3, 5, 10, 20 and 50 days after the sub-10 close. For the 20 day period, the VIX has always rallied at least 10% and an average of 19% from the low. For the 10 day period, the returns are more widely dispersed, but the average is 22%. If we look out 50 days, the minimum return is 47% and the average return is 60%. The important caveat is that the 50 day ROI data do not yet include reaction to the 2006-07 VIX lows.

Now that investors have become somewhat accustomed to the low VIX numbers, we’ve been hearing the “It’s different this time!” calls for the past few months – and perhaps it is. Today is the 22nd day in a row that the VIX has set a new low for the 100 day SMA. I’m not convinced that it is different this time, but I do think that any knee-jerk reaction to buying VIX calls is not the best way to approach the current situation.

DISCLAIMER: "VIX®" is a trademark of Chicago Board Options Exchange, Incorporated. Chicago Board Options Exchange, Incorporated is not affiliated with this website or this website's owner's or operators. CBOE assumes no responsibility for the accuracy or completeness or any other aspect of any content posted on this website by its operator or any third party. All content on this site is provided for informational and entertainment purposes only and is not intended as advice to buy or sell any securities. Stocks are difficult to trade; options are even harder. When it comes to VIX derivatives, don't fall into the trap of thinking that just because you can ride a horse, you can ride an alligator. Please do your own homework and accept full responsibility for any investment decisions you make. No content on this site can be used for commercial purposes without the prior written permission of the author. Copyright © 2007-2023 Bill Luby. All rights reserved.
 
Web Analytics