Showing posts with label 2% correction. Show all posts

Monday, August 31, 2009

JunkDEX Component Performance

I am delighted to see that JunkDEX Tracks Speculative Frenzy in Financials and the JunkDEX itself appear to have hit a nerve and have generated such positive feedback.

To some extent, one could argue that the selection of the individual components of the JunkDEX was done in a somewhat arbitrary fashion and consequently, the performance of the index is somewhat biased by the hand-picked issues that tell a particular story.

I already mentioned the exclusion of Freddie Mac (FRE), largely because the company’s business, financial history and stock performance is so similar to that of Fannie Mae (FNM). I also looked at Lehman Brothers (LEHMQ), which gave us the LEHVIX, among other memories. LEHMQ was up 200% on Friday and is up another 50% so far today. I even toyed with the idea of General Motors (MTLQQ), but as both of these issues trade on the pink sheets, I did not want to venture into that netherworld.

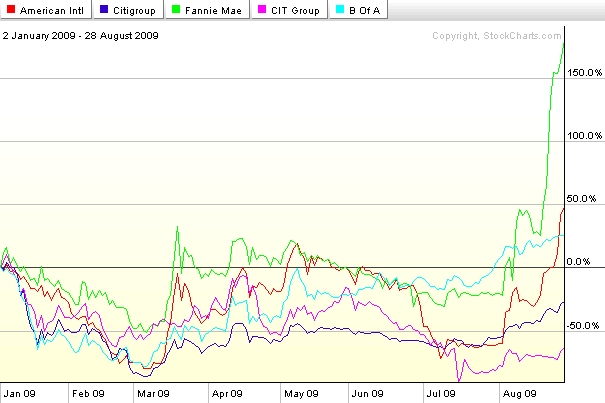
For some historical context, I thought it would be helpful to provide some individual component performance charts for the JunkDEX. The first chart covers the full span of the JunkDEX, dating back to the beginning of 2009. It shows particularly strong performance on the part of Fannie Mae and American International Group (AIG):
The second chart reflects performance in each of the five components over the course of the last five weeks. Given the relatively short time frame for this data, I find the percentage changes to be even more interesting. While FNM and AIG are still the top performers, both Citigroup (C) and CIT Group (CIT) have doubled during this period. Bank of America (BAC), which is weighted down by a market cap of $153 billion, is considerably less nimble, yet still has a gain of 37% in the past five weeks:
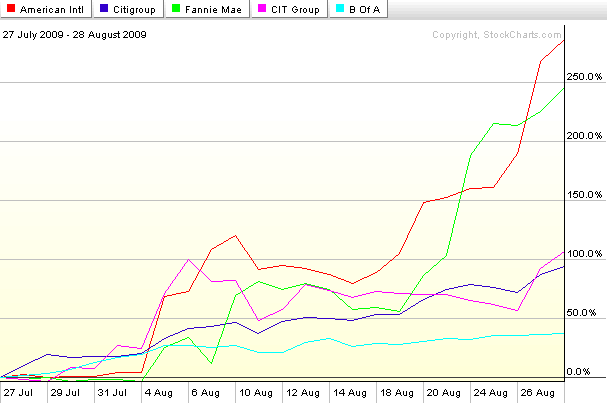
In today’s trading, AIG is down 11.5%, FNM is down 5.4% and only CIT is showing a gain.

[graphics: StockCharts.com]

[Disclosure: short AIG at time of writing]

Tuesday, November 25, 2008

Citigroup Rescue Triggers Improvement in Credit Default Swaps

Yesterday’s announcement of a $306 billion toxic asset safety net for Citigroup (C) was warmly received in the equity markets and has the potential for helping triggering the first three day rally in stocks since what seems like the Eisenhower administration.

Perhaps even better than the news in the equity markets is the impact that the Citigroup rescue has had in the pricing of credit default swaps (CDS) of financial institutions. Yesterday, for instance, the cost of credit default insurance at Citigroup was essentially cut in half, which is not surprising, given the nature of the agreement. The domino effect at other troubled financial institutions was notable, with CDS prices improving as follows:

  • Goldman Sachs (GS): 68 basis points (18%)
  • Berkshire Hathaway (BRK-A): 86 basis points (19%)
  • Morgan Stanley (MS): 74 basis points (14%)
  • Hartford Insurance Group (HIG): 214 basis points (10%)

For those not versed in the details of credit default swap pricing, each basis point translates into $1000 per year for 5 years to insure $10 million worth of debt, so a 5 year $10 million CDS for Goldman Sachs became $68,000 cheaper in the wake of the Citigroup deal.

The market likes the deal. I think the approach makes sense. Better yet, the Citigroup rescue may provide a workable template for how to best deal with troubled financial institutions in a manner than the government, firm, and market all find acceptable.

Monday, February 26, 2007

“Let’s see if you bastards can do 90!”

About a month ago, I remarked on some comments from Doug Kass about how the markets looked a lot like 1994, which was a decidedly down year for equities. Now Bernie Schaeffer tells us that the WABAC machine (not to be confused with the highly entertaining internet archives ‘wayback machine’) should actually be set to 1995, not 1994.

The difference, of course, is substantial. In 1995, we saw the beginning of a glorious bull run that lasted through until early 2000. Those who loaded up on long positions in 1994 probably had a substantial hole to dig out of before they could enjoy the fruits of the 1995 bull – if they didn’t give up entirely in the interim.

In “Market Parallels with 1995,” Schaeffer makes the case for parallels with the beginning of the 1995 bull as follows:

“Joseph Keating, chief investment strategist at First American Asset Management, recently pointed out in an article that the SPX's price-to-earnings (P/E) ratio fell to 17 as of the third quarter of 2006 - lowest since mid-1995. Meanwhile, the SPX has now gone 221 days without a two-percent correction. This compares to the 223-day streak experienced in 1995.

Furthermore, we find the market in another in a low-volatility environment, as the CBOE Market Volatility Index (VXO) currently hovers around levels similar to those we saw in 1995. “

Personally, I think it looks more like 2017 than anything else. If forced to choose to match my outlook with one year over the other, I’d pick 1994 over 1995, but what do I know, I’m just living in my own little VIX-centric universe…

DISCLAIMER: "VIX®" is a trademark of Chicago Board Options Exchange, Incorporated. Chicago Board Options Exchange, Incorporated is not affiliated with this website or this website's owner's or operators. CBOE assumes no responsibility for the accuracy or completeness or any other aspect of any content posted on this website by its operator or any third party. All content on this site is provided for informational and entertainment purposes only and is not intended as advice to buy or sell any securities. Stocks are difficult to trade; options are even harder. When it comes to VIX derivatives, don't fall into the trap of thinking that just because you can ride a horse, you can ride an alligator. Please do your own homework and accept full responsibility for any investment decisions you make. No content on this site can be used for commercial purposes without the prior written permission of the author. Copyright © 2007-2023 Bill Luby. All rights reserved.
 
Web Analytics
