Showing posts with label MS. Show all posts

Tuesday, September 15, 2009

Implied Volatility of 19 Large Financial Institutions: Now vs. 52 Week Highs

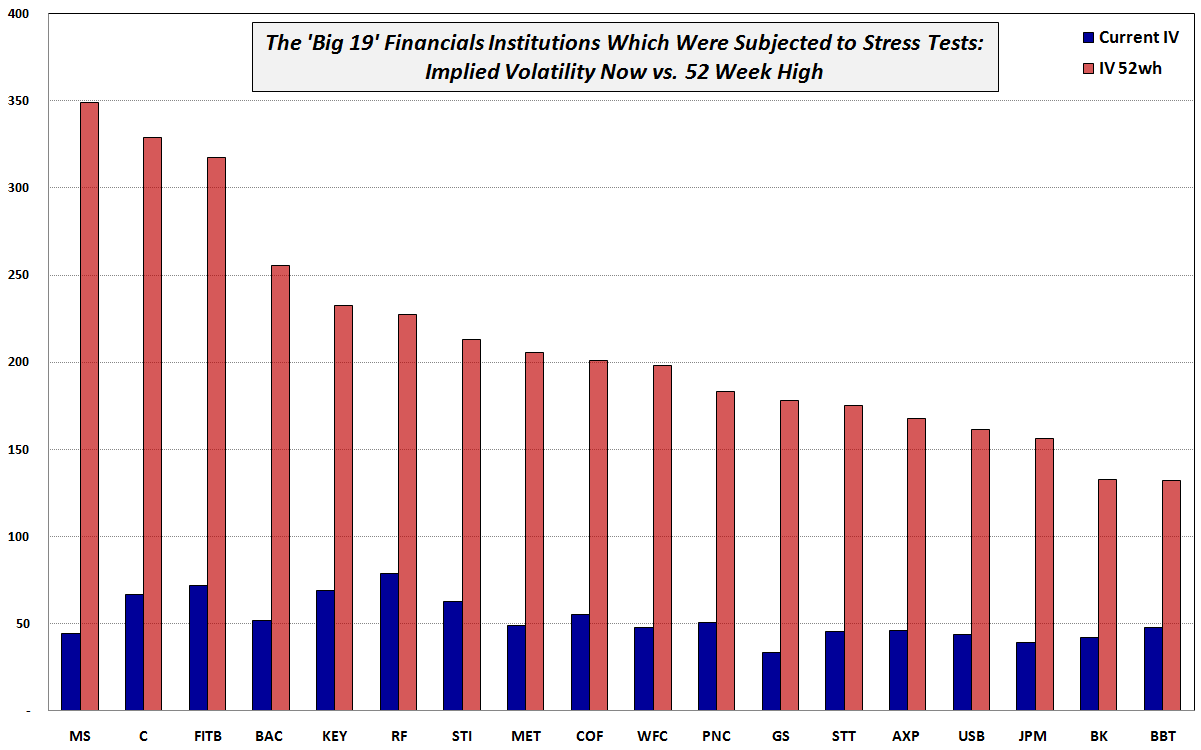
Sunday’s chart of the week, which looked at Implied Volatility of DJIA Components: Now vs. 52 Week High, received enough interest to warrant a follow-up that examines the current implied volatility vs. the 52 week high IV of the 19 financial institutions which were subjected to the government stress tests. [link to stress test results]

The chart below sorts the financial institutions from left to right according to their 52 week implied volatility highs, with GM omitted. While not captured in the graphic, I find it interesting that the two institutions whose current IV is the lowest compared to the high IV are Morgan Stanley (MS) at 12.7% of the 52 week high and Goldman Sachs (GS) at 18.9% of the 52 week high. Those institutions whose current IV is closest to the 52 week high (in percentage terms) are BB&T (BBT) at 36.3% and Regions Financial (RF) at 34.6%.

So…going solely on the percentage retracement from implied volatility highs, it appears as if the investment banks are healthiest and have shed the most risk, while regional banks have undergone a much more measured healing process – about what one might expect. Clearly this is a story of multiple different pathways back to financial health.
[source: International Stock Exchange]

Monday, March 30, 2009

Recent Financial Sector Component Performance

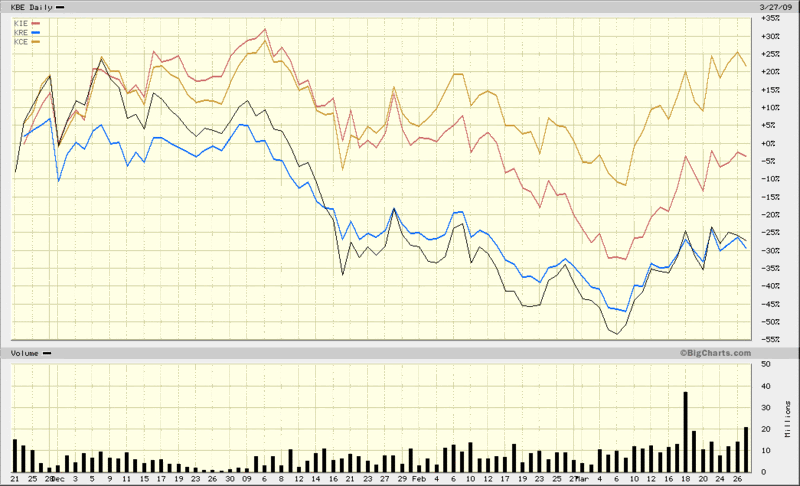
Back in early December, in Breaking Down the Financial Sector Post-Lehman, I contrasted the broad-based KBW Bank Index ETF (KBE) with several other KBW financial sector ETFs, notably KRE (KBW regional banking index), KCE (KBW capital markets index) and KIE (KBW insurance index.) At that time, the regional banking index was holding up better than its siblings, but had begun to show some weakness.

Fast forward almost four months and in the chart below I contrast the performance of the same quartet of ETFs since the November 21st bottom (SPX 741), when things probably looked darkest for the financial sector.

Notice that now the capital markets group (with top holdings of GS, MS, CME, SCHW and STT) is sporting gains of over 20% since this period, while insurance stocks are almost back to breaking even and both banking ETFs, the regional and money center variants, have been bring up the rear, moving almost in lockstep as of late and showing losses in excess of 25% for the period in question. All four groups have bounced impressively off of the March lows, but once again, it is the capital markets group that has showed the most strength, with State Street (STT) leading the way.

[source: BigCharts]

Tuesday, November 25, 2008

Citigroup Rescue Triggers Improvement in Credit Default Swaps

Yesterday’s announcement of a $306 billion toxic asset safety net for Citigroup (C) was warmly received in the equity markets and has the potential for helping triggering the first three day rally in stocks since what seems like the Eisenhower administration.

Perhaps even better than the news in the equity markets is the impact that the Citigroup rescue has had in the pricing of credit default swaps (CDS) of financial institutions. Yesterday, for instance, the cost of credit default insurance at Citigroup was essentially cut in half, which is not surprising, given the nature of the agreement. The domino effect at other troubled financial institutions was notable, with CDS prices improving as follows:

  • Goldman Sachs (GS): 68 basis points (18%)
  • Berkshire Hathaway (BRK-A): 86 basis points (19%)
  • Morgan Stanley (MS): 74 basis points (14%)
  • Hartford Insurance Group (HIG): 214 basis points (10%)

For those not versed in the details of credit default swap pricing, each basis point translates into $1000 per year for 5 years to insure $10 million worth of debt, so a 5 year $10 million CDS for Goldman Sachs became $68,000 cheaper in the wake of the Citigroup deal.

The market likes the deal. I think the approach makes sense. Better yet, the Citigroup rescue may provide a workable template for how to best deal with troubled financial institutions in a manner than the government, firm, and market all find acceptable.

Thursday, September 25, 2008

Recent Volatility in Corporate Bonds

There is a good reason why you rarely hear about high volatility and bonds in the same sentence. It is the same reason why people don’t debate whether the grass is growing faster on Thursday than it was on Wednesday or whether the paint is taking longer to dry than usual. For the most part, bond volatility is nano-volatility.

Until last week, that is.

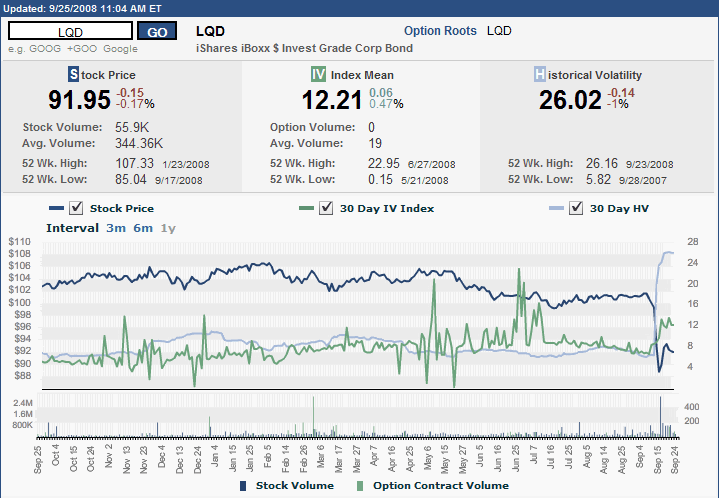
The graphic below (courtesy of the ISE) shows one year of pricing, implied volatility, and historical volatility for the iShares iBoxx $ Investment Grade Corporate Bond ETF (LQD). Looking solely at implied volatility, one would be tempted to conclude that March was relatively uneventful and the real difficulties in the bond market were from early May through early July. The price of the ETF and the historical volatility, however, tell another story. Rarely will you find a chart where historical volatility spiked to such dramatic levels without first seeing a rise in implied volatility that hints at what is coming.

A large part of the reason for the dramatic spike is that in addition to the general freezing of the credit markets, as recently a few months ago half of LQD’s holdings were in the financial sector. One only has to check the list of current holdings to see that LQD continues to own bonds issued by Lehman Brothers and AIG, as well as Wachovia (WB), Goldman Sachs (GS), Morgan Stanley (MS), and other names that have recently come under extreme pressure.

Depending upon your intermediate to long-term view of the U.S. economy, LQD could be an interesting buy and hold investment, if one is interested taking an approach not too different than what is being proposed by Paulson, et al. As always, caveat emptor.

Monday, March 24, 2008

Recent Investment Bank Performance

Last Tuesday, Goldman Sachs (GS) and Lehman Brothers (LEH) announced better than expected earnings that helped to bolster confidence in the investment banking sector. Later that same day, the Fed cut the target Fed funds rate to 2.25% and opened up a Primary Dealer Credit Facility to provide additional liquidity for investment banks. With these moves, the odds have increased that the recent risk to the financial system has already peaked – though it will undoubted take a considerable period before this is fully reflected in improved balance sheets and investor confidence.

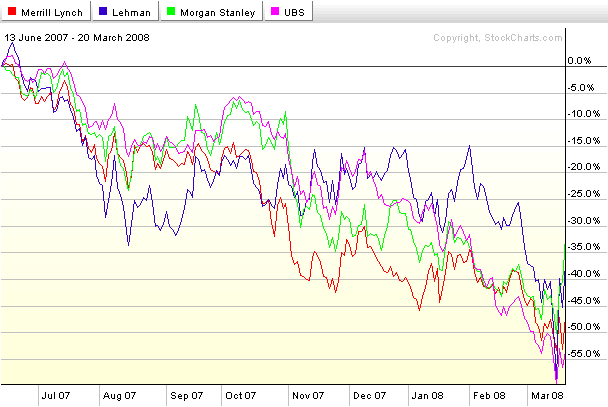
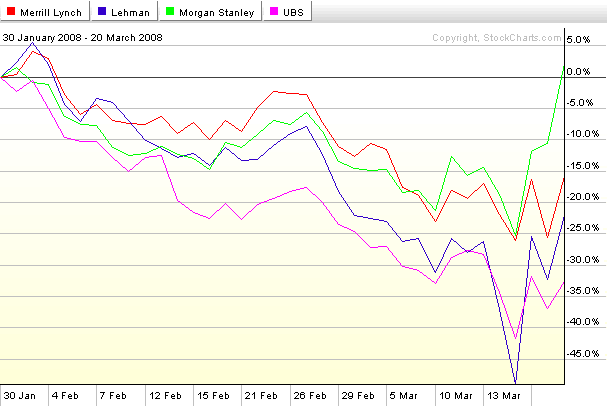
The charts below show the performance of the stocks of four of the severely beleaguered investment banks (MER, LEH, MS, UBS) during the past 195 days from the June 2007 highs, as well as during the most recent 36 days, when the pressure on these institutions was greatest. One inescapable conclusion is that UBS has been the least resilient among the group so far – a development that bears watching going forward.


DISCLAIMER: "VIX®" is a trademark of Chicago Board Options Exchange, Incorporated. Chicago Board Options Exchange, Incorporated is not affiliated with this website or this website's owner's or operators. CBOE assumes no responsibility for the accuracy or completeness or any other aspect of any content posted on this website by its operator or any third party. All content on this site is provided for informational and entertainment purposes only and is not intended as advice to buy or sell any securities. Stocks are difficult to trade; options are even harder. When it comes to VIX derivatives, don't fall into the trap of thinking that just because you can ride a horse, you can ride an alligator. Please do your own homework and accept full responsibility for any investment decisions you make. No content on this site can be used for commercial purposes without the prior written permission of the author. Copyright © 2007-2023 Bill Luby. All rights reserved.
 
Web Analytics