Showing posts with label LQD. Show all posts

Friday, August 17, 2012

What If Stocks Decline?

Successful investors are the ones that are always making plans for all sorts of contingencies, so it stands to reason that they should even prepare themselves for the possibility of stocks actually declining one of these days...

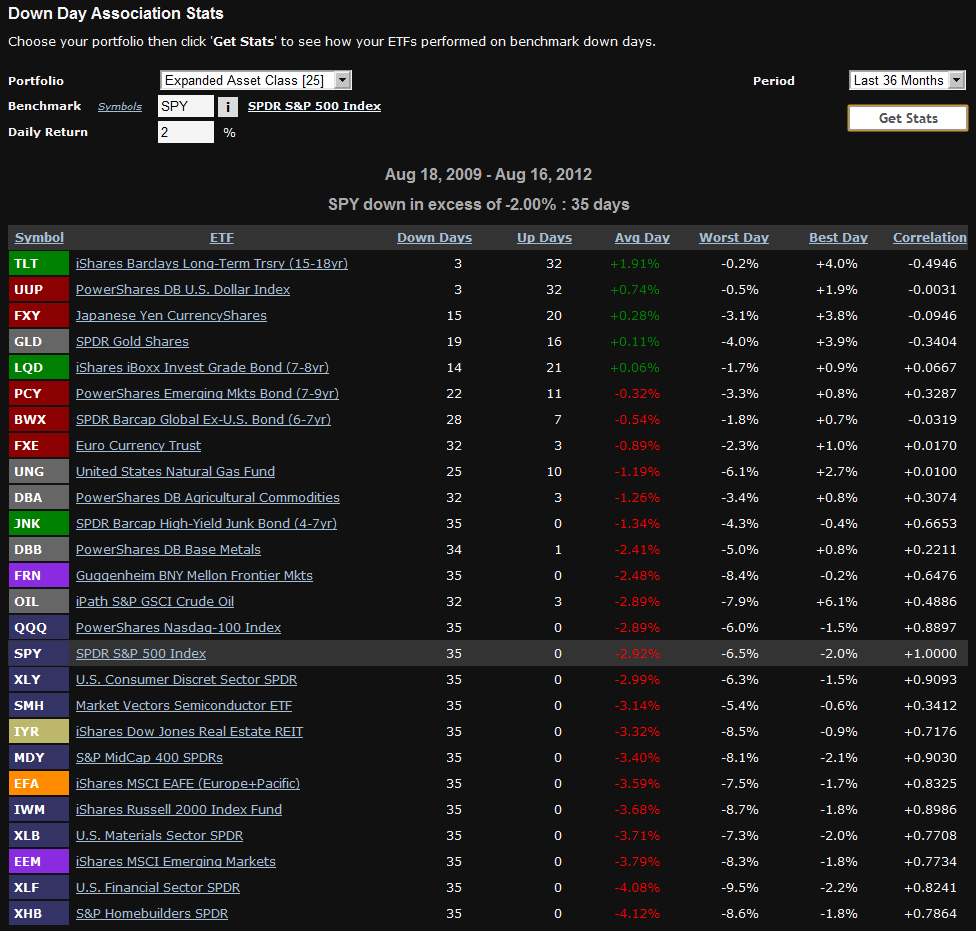
I was thinking about the coming correction in stocks and how to position my portfolio for that moment when equities once again feel the effects of gravity when I stumbled upon an interesting tool at ETFreplay.com that they call their Down Day Association Stats. In a nutshell, it looks at the performance of a group of user-specified exchange-traded products on those days in which a benchmark falls X%.

In the example below, I have chosen SPY as my benchmark, 2% (per day) as my threshold decline and 36 months as my lookback period. I looked at 25 ETPs that cover a wide range of asset classes and investment approaches.

Some of the results from the Down Day Association Stats are not particularly surprising. For instance, the long bond (TLT) and the dollar (UUP) have a strong negative correlation to stocks and generally perform well when SPY declines sharply. Some of the other bond choices (LQD, PCY, BWX) have been better at treading water than countertrending, but also show the benefits of diversification. The commodity choices were somewhat disappointing, generally managing to lose at best half as much as SPY, with crude oil almost matching the declines in the SPY to the penny.

Among the data points that surprised me were that the frontier ETF (FRN) fared better than the SPY in big down days, while real estate (IYR) fared worse.

Of course every decline in stocks has a different set of catalysts and puts different stresses on different asset classes, sectors and geographies, but as stocks continue to grind higher, be sure to make preparations for that eventual pullback, because when it finally does arrive, it will likely do so at an inconvenient time and with surprising swiftness.

Related posts:

[source(s): ETFreplay.com]

Disclosure(s): long LQD at time of writing
Tuesday, August 18, 2009

CWB: A New(ish) Convertible Bond ETF

I have never been a particularly big fan of convertible bonds, but from time to time, these investments can make a good deal of sense.

Launched four months ago (and still qualifying as “new” according to my warped ETF chronograph), the SPDR Barclays Capital Convertible Bond ETF (CWB) is designed to track the price and yield performance of the Barclays Capital U.S. Convertible Bond >$500MM Index.

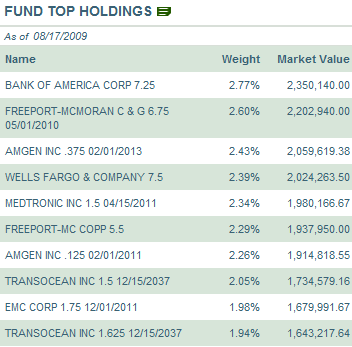
The table to the right shows the ETFs top holdings as of yesterday’s close, which include a top three of Bank of America (BAC), Freeport-McMoRan (FCX) and Amgen (AMGN). This same snapshot of current top ten holdings can be found here.
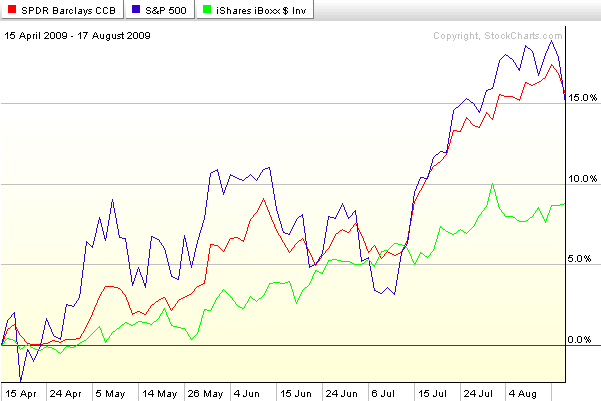
Since the launch of CWB on April 16th, the bull market performance of this ETF has matched the SPX almost step for step, with lower volatility. In the chart below, CWB is represented by the red line, the SPX is in blue, and the iShares iBoxx $ Investment Grade Corporate Bond ETF (LQD) is shown in green. This chart is an almost perfect illustration of why convertible bond ETFs (or closed-end fund or mutual fund) can be a powerful addition to one’s portfolio. At its best, in bull markets, convertibles have an upside comparable to stocks, with less downside risk. At their worst, which is generally in non-trending markets or bearish markets, the lower yield and expense of owning options that do not appreciate makes convertibles inferior to standard bonds.

Of course, options savvy investors will probably wish to buy their own bond ETF and cherry pick their favorite options plays, but for those who wish to forego a customized approach and stick with an off-the-shelf product, CWB is – for the moment at least – the only ETF which is up to the task.

[graphic: StockCharts]

Thursday, September 25, 2008

Recent Volatility in Corporate Bonds

There is a good reason why you rarely hear about high volatility and bonds in the same sentence. It is the same reason why people don’t debate whether the grass is growing faster on Thursday than it was on Wednesday or whether the paint is taking longer to dry than usual. For the most part, bond volatility is nano-volatility.

Until last week, that is.

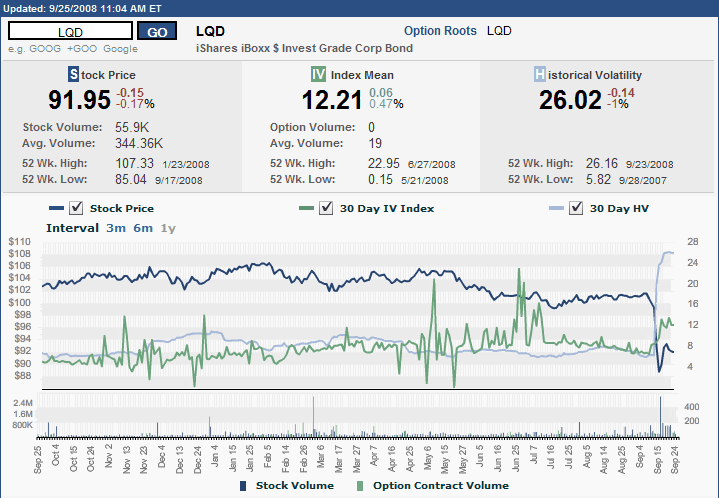
The graphic below (courtesy of the ISE) shows one year of pricing, implied volatility, and historical volatility for the iShares iBoxx $ Investment Grade Corporate Bond ETF (LQD). Looking solely at implied volatility, one would be tempted to conclude that March was relatively uneventful and the real difficulties in the bond market were from early May through early July. The price of the ETF and the historical volatility, however, tell another story. Rarely will you find a chart where historical volatility spiked to such dramatic levels without first seeing a rise in implied volatility that hints at what is coming.

A large part of the reason for the dramatic spike is that in addition to the general freezing of the credit markets, as recently a few months ago half of LQD’s holdings were in the financial sector. One only has to check the list of current holdings to see that LQD continues to own bonds issued by Lehman Brothers and AIG, as well as Wachovia (WB), Goldman Sachs (GS), Morgan Stanley (MS), and other names that have recently come under extreme pressure.

Depending upon your intermediate to long-term view of the U.S. economy, LQD could be an interesting buy and hold investment, if one is interested taking an approach not too different than what is being proposed by Paulson, et al. As always, caveat emptor.

DISCLAIMER: "VIX®" is a trademark of Chicago Board Options Exchange, Incorporated. Chicago Board Options Exchange, Incorporated is not affiliated with this website or this website's owner's or operators. CBOE assumes no responsibility for the accuracy or completeness or any other aspect of any content posted on this website by its operator or any third party. All content on this site is provided for informational and entertainment purposes only and is not intended as advice to buy or sell any securities. Stocks are difficult to trade; options are even harder. When it comes to VIX derivatives, don't fall into the trap of thinking that just because you can ride a horse, you can ride an alligator. Please do your own homework and accept full responsibility for any investment decisions you make. No content on this site can be used for commercial purposes without the prior written permission of the author. Copyright © 2007-2023 Bill Luby. All rights reserved.
 
Web Analytics