Showing posts with label LEHVIX. Show all posts

Monday, August 31, 2009

JunkDEX Component Performance

I am delighted to see that JunkDEX Tracks Speculative Frenzy in Financials and the JunkDEX itself appear to have hit a nerve and have generated such positive feedback.

To some extent, one could argue that the selection of the individual components of the JunkDEX was done in a somewhat arbitrary fashion and consequently, the performance of the index is somewhat biased by the hand-picked issues that tell a particular story.

I already mentioned the exclusion of Freddie Mac (FRE), largely because the company’s business, financial history and stock performance is so similar to that of Fannie Mae (FNM). I also looked at Lehman Brothers (LEHMQ), which gave us the LEHVIX, among other memories. LEHMQ was up 200% on Friday and is up another 50% so far today. I even toyed with the idea of General Motors (MTLQQ), but as both of these issues trade on the pink sheets, I did not want to venture into that netherworld.

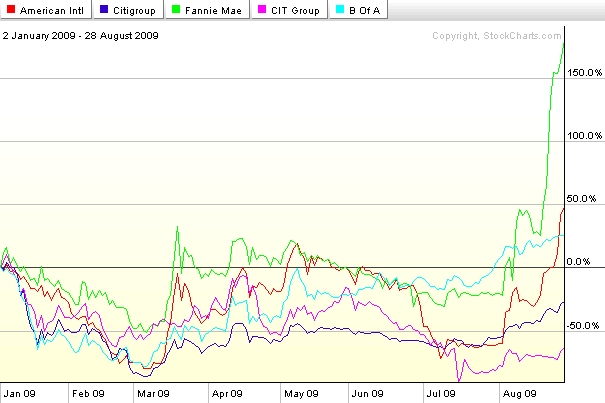
For some historical context, I thought it would be helpful to provide some individual component performance charts for the JunkDEX. The first chart covers the full span of the JunkDEX, dating back to the beginning of 2009. It shows particularly strong performance on the part of Fannie Mae and American International Group (AIG):
The second chart reflects performance in each of the five components over the course of the last five weeks. Given the relatively short time frame for this data, I find the percentage changes to be even more interesting. While FNM and AIG are still the top performers, both Citigroup (C) and CIT Group (CIT) have doubled during this period. Bank of America (BAC), which is weighted down by a market cap of $153 billion, is considerably less nimble, yet still has a gain of 37% in the past five weeks:
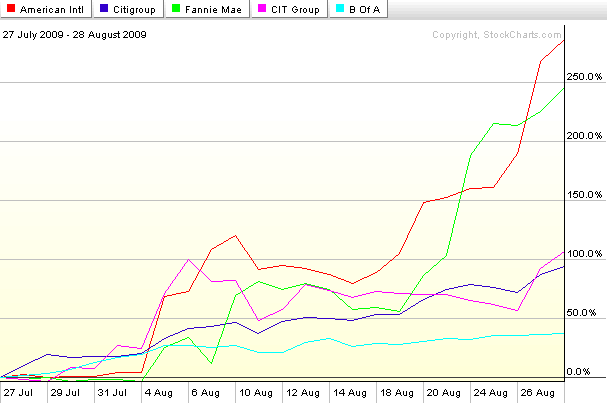
In today’s trading, AIG is down 11.5%, FNM is down 5.4% and only CIT is showing a gain.

[graphics: StockCharts.com]

[Disclosure: short AIG at time of writing]

Friday, January 16, 2009

Can Bank of America Find Support at 7.50?

The 7.50 area provided some support for Bank of America (BAC) yesterday. As the stock continues to fall, I am beginning to wonder where today's support level will be.

BAC is right at 7.50 as I type this.

Can a BAC version of the LEHVIX be far away?

Thursday, October 30, 2008

Recent Volatility and VIX Macro Cycles

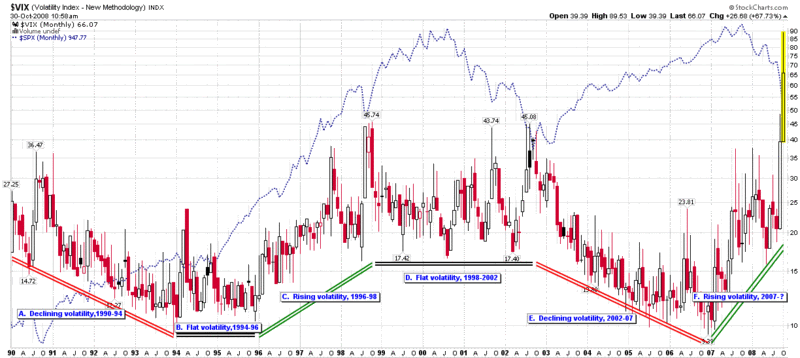
The science art of forecasting volatility more than a couple of weeks out has always struck me as a lot more like astrology than astronomy, so it was with some mild apprehension that I thought I should update my VIX macro cycle chart here and see what previous posts in this area predicted for 2008.

The good news is that in December 2007 in Was 2007 the Beginning of a New Era in Volatility?, I managed at least to nail the persistence of the recent trend by noting, “the current rise in volatility should persist through all of 2008, even if the rate of rise in volatility begins to slow.” In what looked like a much safer prediction, I said, “the rate of change in volatility over the course of 2007 is unsustainable going forward – or at least inconsistent with the slope of volatility macro cycles during previous cycles.” As the monthly chart below shows, the VIX essentially moved sideways to down from July 2007 through August 2008, at which point the recent volatility began in earnest.

My most recent VIX macro cycle update comes from March 19, 2008, just three days after Bear Stearns was sold to JP Morgan (JPM). At that point in time many believed volatility seemed to understate the gravity of the financial turmoil. For historical context, I will repeat my assessment at the time:

I still anticipate that volatility will spend a good portion of 2008 in the neighborhood of 22-26. Looking at the current VIX futures quotes, where the May through December futures are all trading just below 26, it looks as if my prediction is on the low end of the market consensus.

The big question I have is about the duration of current VIX macro cycle – and of course the slope of any continued increase in volatility. If the current slope of the volatility increase holds and the minimum cycle time is two years, that would project to a sustained VIX of about 40 by the end of the year. I don’t expect to see that scenario unfold, but it will be interesting to see how long it takes for the runup in volatility that started about 15 months ago to run out of steam.

So…7 ½ months later I can say that my prediction held up through mid-September, but once Lehman Brothers filed for bankruptcy, the LEHVIX and VIX went through the roof and my predictions went out the window.

From a macro cycle perspective the two questions to ask now are how long the current cycle of increasing volatility should last and what direction the next cycle will take. Using the historical norms of a 2-4 year cycle and considering the steep trajectory of the recent 22 months of increasing volatility, I suspect that the current cycle is nearing an end and either topped out at the beginning of the week or will see one final topping move in the next month or two.

The direction of the next move is the bigger question and the more difficult one to answer. Two of the three previous changes in volatility have ended in a multi-year sideways move. Given some of the structural and fundamental challenges currently facing the economy, the easier prediction to make seems to be several years of elevated volatility.

I am going to go out on a limb, however, and stick to my fear bubble thesis to predict that volatility will be on the wane over the course of the next two years or so. Don’t succumb to anchoring when it comes to a VIX of 70. Just two months ago the VIX was in the teens. While it may be awhile before the VIX returns to the teens, I would not be surprised if the VIX were back in the 20s in another 2-3 months.

Of course, a large part of the path forward will be strongly influenced by the policies and regulations put into place by governments that have yet to take office – all of which substantially increase uncertainty around any prediction.

[source: StockCharts, VIX and More]

Tuesday, June 10, 2008

The LEHVIX

Yesterday I heard myself joke that lately I had not been watching the VIX as closely as I used to, because I had jettisoned the VIX in favor of Lehman Brothers (LEH) as my favored indicator of fear and anxiety. OK, so maybe I was more serious than joking.

In a recent poll of a group of savvy investors, I found it interesting that the two issues these investors are most concerned about vis-à-vis their investments are the stability of financial institutions and increasing inflation. Of course, Lehman Brothers is still the poster child for investor anxiety about the stability of financial institutions, just as it was when I first applied this label back in March.

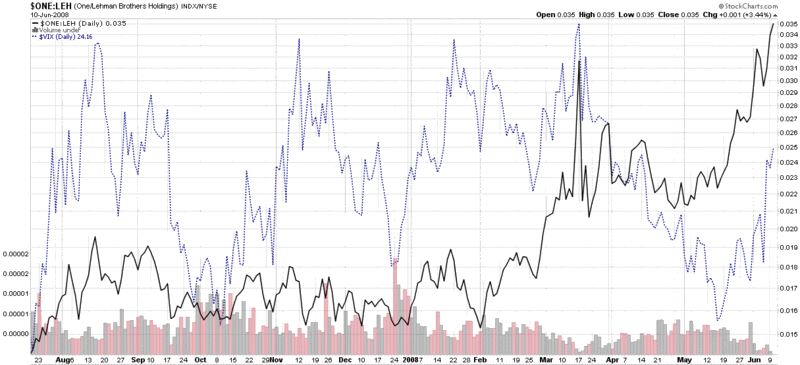
So what does a LEHVIX look like? Well…thanks to StockCharts.com, you can invert the LEH price chart and have the precipitous price drops look like spikes instead, as I have done in the chart below. Now compare the VIX (dotted blue) line with LEH (solid black line) and ask yourself which best represents the level of fear and anxiety you have experienced with respect to the markets. The VIX shows roughly equal levels of concern in August, November, January, and March. The LEHVIX (inverted LEH price history) shows a blip in August and January, but sheer panic in March and again in June. In this case, I think LEH has a better fix on fear and anxiety than the VIX. Of course, your mileage may vary…

DISCLAIMER: "VIX®" is a trademark of Chicago Board Options Exchange, Incorporated. Chicago Board Options Exchange, Incorporated is not affiliated with this website or this website's owner's or operators. CBOE assumes no responsibility for the accuracy or completeness or any other aspect of any content posted on this website by its operator or any third party. All content on this site is provided for informational and entertainment purposes only and is not intended as advice to buy or sell any securities. Stocks are difficult to trade; options are even harder. When it comes to VIX derivatives, don't fall into the trap of thinking that just because you can ride a horse, you can ride an alligator. Please do your own homework and accept full responsibility for any investment decisions you make. No content on this site can be used for commercial purposes without the prior written permission of the author. Copyright © 2007-2023 Bill Luby. All rights reserved.
 
Web Analytics