Showing posts with label 1998. Show all posts

Tuesday, May 19, 2009

Where Will the VIX Bottom?

As I write this, the VIX is at 28.80, after making an intraday low of 28.51 earlier in the session. Since this is the first time the VIX has traded below 30.00 since the middle of September, I am finding there is a great deal of interest in and speculation surrounding where the VIX will ultimately bottom – and what the implications are for equities.

In both How Low Can the VIX Go? and The New VIX Macro Cycle Picture, I predicted that the VIX is not likely to drop below the 25-26 level – and I am standing by that prediction. Actually, in my newsletter I have been a little more precise, saying during the past few weeks that I do not anticipate the VIX falling below 28.00 “for this leg of the bull market.” Frankly, this leg looks a little long in the tooth to me at the moment, but based on the recent price action, the current phase has more of the appearance of consolidation than reversal or impending reversal.

I have weighed in on several occasions about the perils of using the full technical analysis toolbox on the VIX, largely because there is no underlying one can buy and sell, given that the VIX is really just a calculated value. For these reasons – and given the VIX’s tendency toward mean reversion – I tend to shy away from momentum indicators and oscillators when evaluating the VIX and treat moving averages and support and resistance with several grains of salt.

Let me take a minute and put a VIX of 25 into some historical context. First, the historical average of the VIX for 20 years of data extending back to 1990 is 20.12 (dotted black line in the chart below.) The mean VIX for all of 2008, which includes a relatively calm April through August, is 32.68. Looking back at the five year period of 1998-2002, which included the Long-Term Capital Management debacle and the end of the 1990s bull market, the average VIX during this period was 25.27. Current data show S&P 500 historical volatility for the 10, 20 and 30 day lookback periods at 30.88, 27.24 and 30.53, respectively.

The bottom line: 25.00 is a low number for a volatile period.

The VIX may be better analyzed in a macroeconomic and geopolitical context than in terms of technical analysis. Ultimately, the VIX is only rarely a fear index. Most of the time, the volatility index is more accurately a measure of uncertainty or investor anxiety. With the bank stress test results behind us, concerns about structural volatility and systemic risk are now receding and being supplanted by lower anxiety concerns that I like to refer to as event volatility. Sure, the economy may have another significant misstep ahead, but talk of wholesale bank nationalization and the prospect of 15% unemployment have been replaced by discussions of green shoots, bottoming and recovery.

[As an aside, for awhile now I have been thinking about constructing something akin to a Beaufort scale for volatility so we can put absolute measures of volatility into a broader context.]

Regarding the current volatility environment, while confidence and liquidity are returning to the markets, keep in mind that for many investors, the financial and psychological scars are still in the healing process. As long as events and markets continue to improve, that healing process will continue. Should events take a sudden turn for the worse, however, I would expect to see volatility spike dramatically in a case of echo volatility, much like what I described in What My Dog Can Tell Us About Volatility.

In the absence of another spike in volatility, I would also expect to see a dramatic decline in the rate that volatility is decreasing, as we begin to approach a floor in volatility. Even as fears dissipate, there is still uncertainty about the strength of the recovery in addition to the normal uncertainty about the direction of the economy and the markets that would be associated with a period of relative market calm.

Historical volatility, therefore, should provide a volatility floor and with historical volatility currently unable to drop below the low to mid-20s, we should begin to see evidence of that volatility floor shortly. I have seen some investors call for the flood of liquidity to push the VIX under 20. I just don’t see it, at least for now. There is the possibility that stocks enter into an extended period of range-bound trading that brings volatility down to the low 20s, but I would be surprised to see a sub-20 VIX by the end of the year.

In 2007, the VIX ended the year at 22.50. While my crystal ball generally does not extend more than a month or two, my best guess is that we see the VIX in the 22.50 to 25.00 range at the end of 2009.
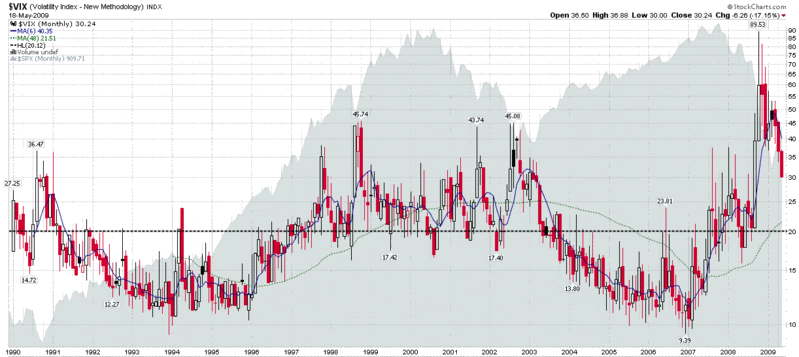
[source: StockCharts]

Thursday, August 16, 2007

2007 vs. 1998 or Subprime vs. LTCM

Those who were active in the markets in 1998 and anyone who is a student of the markets should be asking themselves how the current subprime mortgage mess compares with the Long-Term Capital Management failure of nine years ago.

If you haven’t already read Roger Lowenstein’s excellent When Genius Failed: The Rise and Fall of Long-Term Capital Management, it isn’t too late to do so. Among the events that Lowenstein recounts is the merciless squeezing of LTCM’s positions by Goldman, Salomon and others, activities that may have strong parallels to some of what is going on behind the scenes right now.

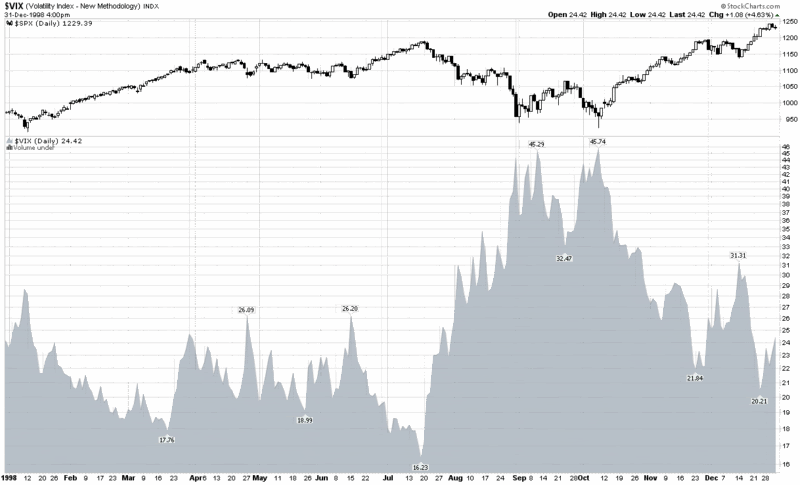
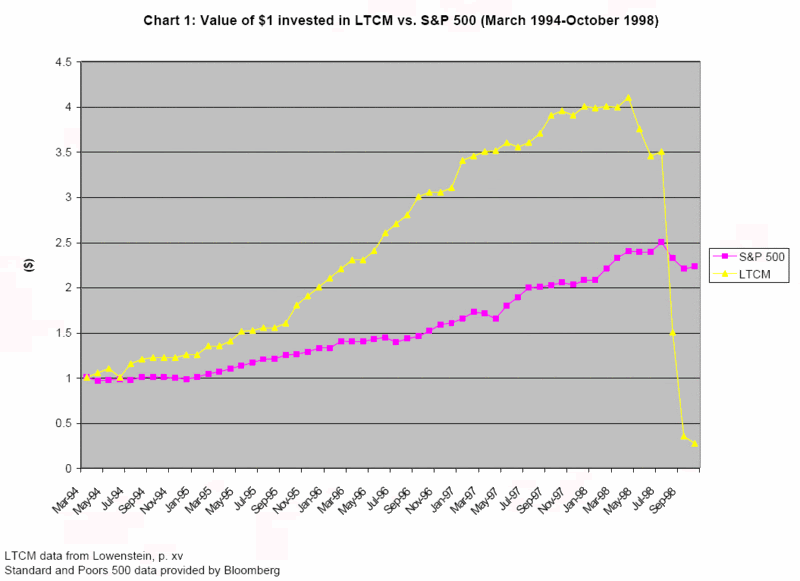
The purpose of today’s comparison is to contrast the magnitude of the volatility triggered by the failure of LTCM to what we have seen in the last two months. Keep in mind that according to Lowenstein, LTCM’s capital peaked in April 1998, as shown in the graphic below from Siddharth Prabhu, who utilizes Lowenstein’s data.


As the graph of VIX and SPX from 1998 toward the bottom demonstrates, LTCM’s small losses from April to July have very little impact on the markets, but as the losses grow (and the Russian financial crisis widens), the VIX nearly triples over the course of two months, while the S&P 500 loses approximately 20%. For more historical context, note that by the end of the year the SPX had recovered all of those losses and moved higher, while the VIX returned almost to the pre-crisis lows.

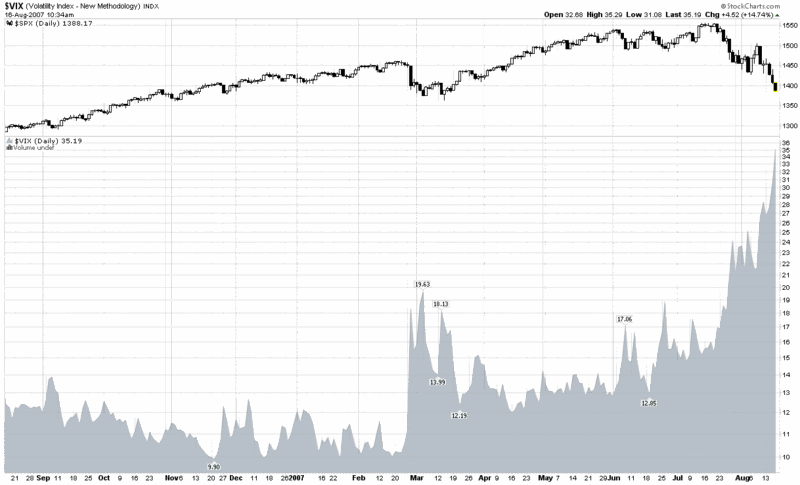
How does the current situation stack up? Looking at the chart at the bottom, once again, the VIX has almost tripled in two months (doubled in one month), while the SPX has lost closer to 10% of its value. For comparative purposes, this means more fear in the current situation, with less in the way of financial losses – at least at this stage.

With LTCM and Amaranth already in the books, you would think that those who are in a position to avert another similar crisis would be in a better position to do so. Keep an eye on the comparisons to 1998 going forward and don’t be so quick to conclude that this time it will be worse than it was nine years ago.


Sunday, August 12, 2007

The Gravity Defying Dance Continues: VWSI Remains at -9

Last week I talked about how the VWSI was in uncharted waters. Given the events of the past week, I might as well rip up the charts. The current waters can’t be any more uncharted than the financial environment can be ‘more unique,’ but let’s just say that the gap between the historical record and the current situation has widened considerably in the past week.

From a numbers perspective, the VIX jumped 17.2% for the week, moving up from 24.15 to 28.30 and now stands 92% above the close from just five weeks ago. With the futures pointing to a rally tomorrow morning, Friday’s high of 29.84 may turn out to be the high water mark in the VIX for the current upward cycle, but this is by no means guaranteed.

The VWSI finished the week at -9 and now has an almost unthinkable three week stretch of -10,-9, and -9. By comparison purposes, the only other three week stretch of significant negative VIX readings was at the height of the Russian financial crisis in August-September 1998, where the VWSI logged consecutive end of week readings of -6,-8, and -4.

I will have more to say about the uncharted waters of the VIX tomorrow, but suffice it to say that I will be all over VIX puts when the market opens.

(Note that in the above temperature gauge, the "bullish" and "bearish" labels apply to the VIX, not to the broader markets, which are usually negatively correlated with the VIX.)

Wine pairing: Unusual times mean unusual wines. I continue to recommend carmenere as an appropriate pairing for a VWSI of -9. Last week I recommend a Concha y Toro 2003 Terrunyo Carmenere as well as some of the favorite carmeneres listed at Cellar Tracker. For those curious about what American wineries are doing with this rare varietal, I encourage you to read about Dover Canyon’s efforts. I will do my best to see if I can find a bottle of their carmenere so that I can report on it the next time the VIX tries a moon shot.

Sunday, August 5, 2007

VWSI Still Holding at -9

In the 17 ½ years of VIX data, the VWSI has never managed register extreme negative reading two weeks in a row…until now. With the VIX spiking to 24.15 on Friday, down 0.02 for the week, the VWSI managed to end the week at -9, just one tick higher than the maximum -10 reading of a week ago. The old record for two consecutive weeks was a rather paltry sounding -6 and -8, which spanned the weeks ending August 28 and September 4, 1998, at the height of the Russian financial crisis.

So while a week ago I spelled out the historical context that argued forcefully for a mean reverting VIX drop this past week, clearly this week’s sideways movement represented another unprecedented turn of events for the VIX. In spite of this, I still anticipate that the VIX will shed some 15-20% in the coming week. If the VIX goes up again this week, then it is time to tweak the VWSI model and/or accept the fact that we are in uncharted volatility waters.

To put things in perspective from a VWSI standpoint, if the VIX holds steady this week, we will probably end the week with a VWSI of about -2. On the other hand, if the VWSI is to remain in the -9 to -10 range for a third consecutive week, it will take a VIX of at least the high 20s to pull that rabbit out of the hat.

(Note that in the above temperature gauge, the "bullish" and "bearish" labels apply to the VIX, not to the broader markets, which are usually negatively correlated with the VIX.)

Wine pairing: After two weeks of heightened volatility, I would be hard pressed to find fault with someone who is still drinking some of the ports from last week. A VWSI of -9, however, calls for a change of pace. What better change of pace then to turn to a varietal that was almost completely wiped out, only to stage a recent comeback over a century later on another continent. I am talking about carmenere, a grape whose rediscovery and revival in Chile is one of the great stories of the wine world. I was lucky enough to have an exceptional Concha y Toro 2003 Terrunyo Carmenere last year and it was one of the tasting highlights of the year. If you are looking for additional suggestions, see which other carmeneres have been getting rave reviews on Cellar Tracker.

Tuesday, May 22, 2007

High Positive Correlation Between VIX and SPX Often Signals Market Weakness

For the benefit of those who may not have been following this story, I will backtrack a little before diving in.


I first talked about the implications of a positive correlation between the SPX and VIX back on April 26th in “Divergence, History and Tells,” when I noticed a change in the recent pattern of SPX and VIX correlations. In a follow-up post on May 4th, “Predictive Value of SPX and VIX Correlation: First Pass,” I offered a preliminary conclusion:
“The bottom line is that a highly correlated SPX and VIX does not bode well for the SPX across all the time frames I have been looking at, which start at three days and go out as far as three months.”
Since the second article, I have been crunching numbers and playing around with various correlation metrics and have concluded that the period of high SPX-VIX correlation was focused primarily from April 25th to May 10th and reflected some high readings not seen since 1998. One noteworthy aspect of the recent period of high correlation was its relatively long duration, again something that has not been observed in some of the correlation metrics since March and April of 1998.

Even though today is setting up to be a rare instance of back to back sessions of positively correlated SPX and VIX readings, the big correlation spike now appears to be in the rear view mirror, at least from a statistical perspective.

In looking at past periods of high positive correlations between the SPX and the VIX, it is notable that the SPX generally performs well below its historical mean for up to three months following the high positive correlation period. I also find it particularly interesting that a period of significant underperformance is often associated with 20 trading days following the peak readings. If you consider April 25th to be the first day of these peak readings, then knowing that tomorrow is day #20 should at least give you some fodder for contemplation.

In sum, always be careful with any trading strategy that assumes a freight train is about to make a U-turn…but understand that it never hurts to be fully prepared for the possibility.

Monday, May 21, 2007

Larry McMillan on a Positively Correlated VIX and SPX

Thanks to the CFE’s Futures in Volatility newsletter, I have a fairly good idea what Larry McMillan is thinking about vis-à-vis a positively correlated VIX and SPX. The May 21, 2007 issue of Futures in Volatility just arrived in my mailbox a few minutes ago and in it McMillan makes the following observations:

“The last few weeks have seen a slow but steady rise in VIX (and in most VIX futures), even though the broad market, as measured by the S&P 500 Index, is rising in price. This is not a phenomenon that is seen too often, but it is not completely unprecedented. Occasionally, one sees a day or two in which VIX rises while the broad market rises, but it is much more unusual to see a trend of that sort. The current trend has lasted one month, but back in the 1990s, there were periods when VIX rose for months while the S&P 500 Index rose as well. If one recalls, VIX was near 10 in late 1994. But during the bull market of the 1990s, VIX rose to the point where it was routinely between 25 and 30 in 1998 and 1999. Yet, during that time, the S&P 500 Index also rose quite strongly, as those were the banner years of that bull market.


In the last month, futures prices have reacted accordingly, although their pricing curve is in a state that has not yet been seen in the 3-year history of VIX futures trading. Most of the VIX futures, Variance futures, and VIX options have followed VIX higher in the last month. VIX products have increased in price much across the board: November 2007 and February 2008 VIX futures are now slightly above 15. Even the August 2007 VIX futures are nearly 15. Does this mean that volatility traders are looking for higher volatility later this year? It certainly seems that way. What is a bit unusual is that there is not really much of a spread between the longer-term contracts…Looking back over the history of VIX futures trading, there are only two other occurrences of similar tightly-packed groupings of VIX futures prices. Those occurred in April and May 2005, and June and July 2006, both of which were times when the market had just fallen and was beginning to rally, so the futures were transitioning between “bearish” and “bullish” shapes. That is not the case now. This is the first time we have seen this construct while the market is rallying. In all likelihood, the futures are indicating that the market is going to become more volatile, regardless of the direction of the S&P 500 Index. It appears that traders expect volatility to be more in line with historical norms (the long-term historical volatility of the S&P 500 Index is approximately 15%).”

McMillan’s remarks dovetail nicely with my thinking in “VIX Futures: The One Picture to Remember” (see the comments, in particular.) Still, I am not yet prepared to make a call on the likelihood of increasing volatility or the direction of the SPX. As far as I’m concerned, the record highs and continued upside momentum in the SPX outweigh any signs of technical weakness or a breakdown in investor sentiment. I will have more to add to my May 4thPredictive Value of SPX and VIX Correlation: First Pass” post in the near future. This time around I will offer only two words of advice: trailing stops.

Friday, March 23, 2007

20% Under the 10 Day SMA, Then What?

As usual, Adam Warner of the Daily Options Report has been all over the latest developments in VIX. He was the first to comment on the VIX falling 20% under its 10 day SMA on Wednesday (actually -19.3%) and has added two follow-up stories, most recently this morning, where he draws comparisons to the June-July VIX walkabout from last year.

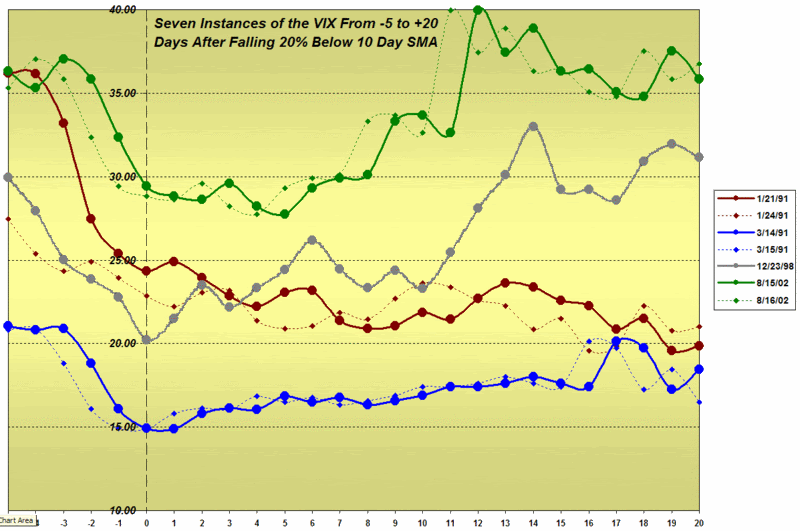
To recap for those why may be link shy, the VIX has closed 20% below the 10 day SMA on seven days since 1990, which I have grouped into four distinct events (one isolated event and three other events with two separate EOD readings,) as follows:

> 8/15-16/2002
> 12/23/1998
> 3/14-15/1991 (3/13 was 19.9% below)
> 1/21/91 and 1/24/91 (1/18 through 1/25 were all at least 18% below)


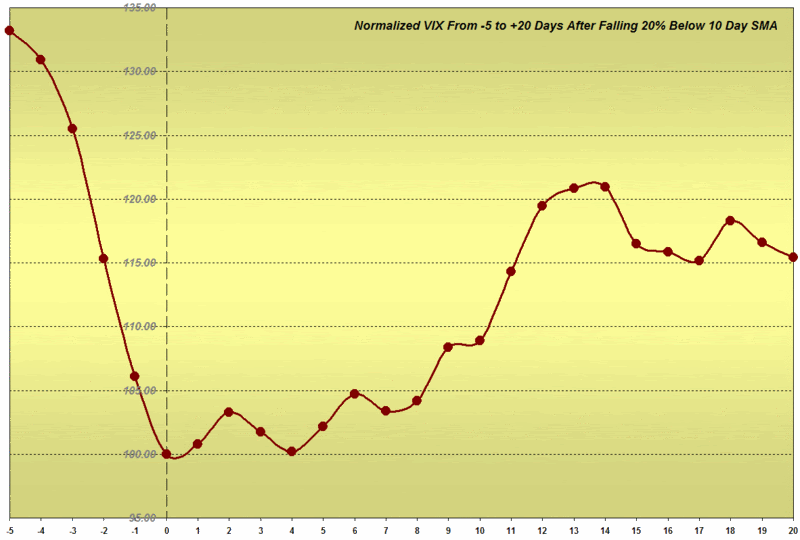
The only additions I will make to Adam’s commentary are two graphs that appear in one form or another on these pages on a fairly regular basis: a composite look at all 7 instances, from 5 days prior to 20 days after the -20% reading; and a rather busy graph of each of those 7 instances, color coded by ‘event,’ with the second -20% reading for each event indicated by a dotted line. The graphs, not surprisingly, suggest a possible mean-reverting move over the next 10-20 trading days, but given the small sample size, I would consider their entertainment/voyeuristic value to be higher than any informational value.

DISCLAIMER: "VIX®" is a trademark of Chicago Board Options Exchange, Incorporated. Chicago Board Options Exchange, Incorporated is not affiliated with this website or this website's owner's or operators. CBOE assumes no responsibility for the accuracy or completeness or any other aspect of any content posted on this website by its operator or any third party. All content on this site is provided for informational and entertainment purposes only and is not intended as advice to buy or sell any securities. Stocks are difficult to trade; options are even harder. When it comes to VIX derivatives, don't fall into the trap of thinking that just because you can ride a horse, you can ride an alligator. Please do your own homework and accept full responsibility for any investment decisions you make. No content on this site can be used for commercial purposes without the prior written permission of the author. Copyright © 2007-2023 Bill Luby. All rights reserved.
 
Web Analytics