Showing posts with label 2002. Show all posts

Sunday, March 21, 2010

Chart of the Week: VIX After 2002 Bottom

With all the comments I have heard about the persistent falling volatility, one would think that the drop in the VIX to below the 17.00 level is an unwarranted aberration. Several factors suggest otherwise.

Perhaps the most impressive statistical evidence in support of a low VIX is the level of 20 day historical volatility in the SPX, which ended the week at 9.10, following a close of 8.68 on Thursday. While it is true that for the course of its history the VIX has generally been higher than historical volatility in the SPX, the average premium is about 35%, not the unusually high 86% from Friday.

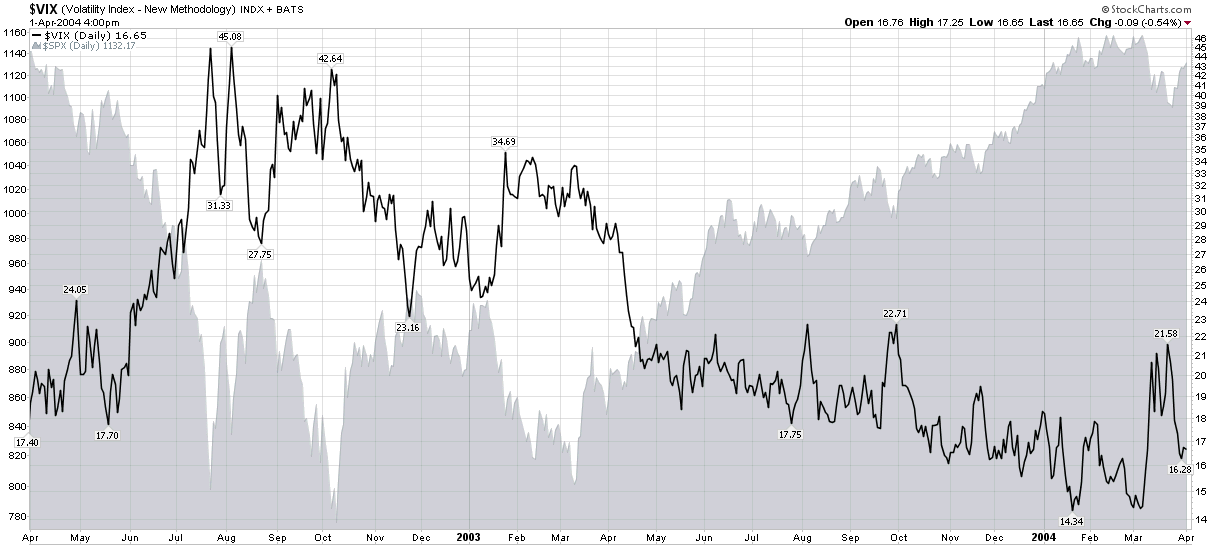
In addition to the statistical evidence, it is also helpful to place the current rally off of a bottom in historical context. In the chart of the week below, which examines the 2002 low, one can see the VIX spiking over 42.00 just as the SPX was bottoming in early October 2002. Some 12 ½ months later, the middle of October 2003, the VIX was hovering in the mid-16s, on the way to a low of about 16.00 by the end of the month and an eventual cycle low in the 14s some 3 ½ months later.

As stocks are now also 12 ½ months away from their March 2009 lows, a VIX in the 16s should not be a surprise, particularly given historical volatility levels, which are generally lower now than they were in October 2003.

As much as I think a lower VIX is possible, my personal forecast is for the VIX to have difficulty gaining traction below the 16.00 level, at least during the April options expiration cycle.

For more on related subjects, readers are encouraged to check out:


[source: StockCharts]

Disclosure(s): none

Monday, June 1, 2009

Eerie Déjà Vu as VIX and SPX Both Jump More Than 2.5%

If you follow me on Twitter (VIXandMore on Twitter), you probably saw my surprise when I asked rhetorically, “When is the last time the VIX was making new intraday highs with the $DJIA up 230?”

While I can’t answer that question (though my guess is that today was a first), I did check to see if today’s close set a record for greatest percentage gains by both the VIX (+3.87%) and the SPX (+2.58%) on the same day.

It turns out there was one previous instance that topped today’s double spike, back on November 27, 2002, which was the day before Thanksgiving. On that day, the VIX was up 4.93% and the SPX gained 2.80%.

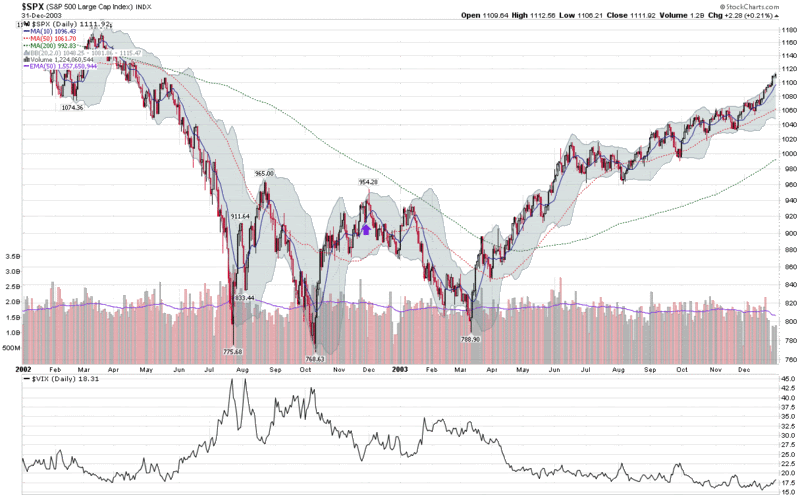
I checked the charts to see how November 27th fit into the 2002-03 bear market lows. As it turns out, November 27th, which I have indicated with a purple arrow in the chart below, was just two days before an intermediate high which preceded a 17.3% drop that led to the final bottom process some 3 ½ months later. From this point, the markets began to rally and were bullish for more than four years.

The chart below recounts the remarkably similar history from 2002. In that year, the bear market associated with the dot com meltdown bottomed first in July and then again in October, where it hit 768. From that October low, the market rallied to 939 on November 27th – numbers that are strikingly similar to the November 2008 low and the subsequent January 2009 high.

In 2003, the SPX put in a third and final bottom of 788.90 on March 12th, before stocks rallied and never looked back.

The question of the day is whether the current market, like November 27, 2002, still has (at least) one more sharp drop in it…or does the current situation bear a closer resemblance to the May 2003 beginning of a new bull market?

For the record, when I relaxed the conditions on the simultaneous VIX and SPX jumps, the day that comes next closest to today and November 27 is May 11, 1990. At that time, stocks were in a bullish uptrend that would continue for another two months, before being interrupted by a 19.8% drop that would last from July to October of that year.

Statistically significant? Of course not. Anecdotally interesting? I think so.

[Finally, if the chart from 2002-03 looks familiar check out Sunday’s Chart of the Week: Emerging Markets. I had to double check to make sure I had not posted the wrong chart.]

[source: StockCharts]

Tuesday, May 19, 2009

Where Will the VIX Bottom?

As I write this, the VIX is at 28.80, after making an intraday low of 28.51 earlier in the session. Since this is the first time the VIX has traded below 30.00 since the middle of September, I am finding there is a great deal of interest in and speculation surrounding where the VIX will ultimately bottom – and what the implications are for equities.

In both How Low Can the VIX Go? and The New VIX Macro Cycle Picture, I predicted that the VIX is not likely to drop below the 25-26 level – and I am standing by that prediction. Actually, in my newsletter I have been a little more precise, saying during the past few weeks that I do not anticipate the VIX falling below 28.00 “for this leg of the bull market.” Frankly, this leg looks a little long in the tooth to me at the moment, but based on the recent price action, the current phase has more of the appearance of consolidation than reversal or impending reversal.

I have weighed in on several occasions about the perils of using the full technical analysis toolbox on the VIX, largely because there is no underlying one can buy and sell, given that the VIX is really just a calculated value. For these reasons – and given the VIX’s tendency toward mean reversion – I tend to shy away from momentum indicators and oscillators when evaluating the VIX and treat moving averages and support and resistance with several grains of salt.

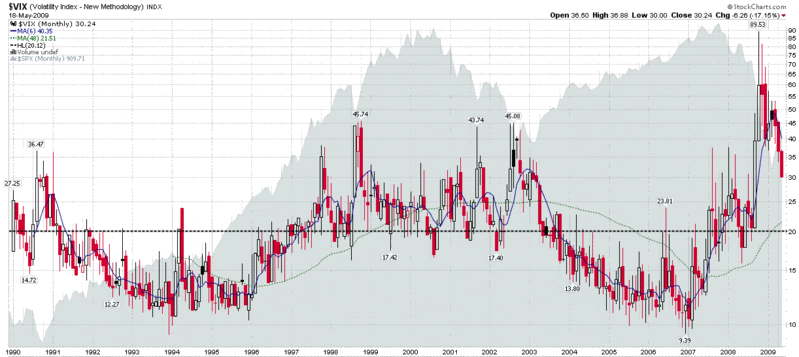
Let me take a minute and put a VIX of 25 into some historical context. First, the historical average of the VIX for 20 years of data extending back to 1990 is 20.12 (dotted black line in the chart below.) The mean VIX for all of 2008, which includes a relatively calm April through August, is 32.68. Looking back at the five year period of 1998-2002, which included the Long-Term Capital Management debacle and the end of the 1990s bull market, the average VIX during this period was 25.27. Current data show S&P 500 historical volatility for the 10, 20 and 30 day lookback periods at 30.88, 27.24 and 30.53, respectively.

The bottom line: 25.00 is a low number for a volatile period.

The VIX may be better analyzed in a macroeconomic and geopolitical context than in terms of technical analysis. Ultimately, the VIX is only rarely a fear index. Most of the time, the volatility index is more accurately a measure of uncertainty or investor anxiety. With the bank stress test results behind us, concerns about structural volatility and systemic risk are now receding and being supplanted by lower anxiety concerns that I like to refer to as event volatility. Sure, the economy may have another significant misstep ahead, but talk of wholesale bank nationalization and the prospect of 15% unemployment have been replaced by discussions of green shoots, bottoming and recovery.

[As an aside, for awhile now I have been thinking about constructing something akin to a Beaufort scale for volatility so we can put absolute measures of volatility into a broader context.]

Regarding the current volatility environment, while confidence and liquidity are returning to the markets, keep in mind that for many investors, the financial and psychological scars are still in the healing process. As long as events and markets continue to improve, that healing process will continue. Should events take a sudden turn for the worse, however, I would expect to see volatility spike dramatically in a case of echo volatility, much like what I described in What My Dog Can Tell Us About Volatility.

In the absence of another spike in volatility, I would also expect to see a dramatic decline in the rate that volatility is decreasing, as we begin to approach a floor in volatility. Even as fears dissipate, there is still uncertainty about the strength of the recovery in addition to the normal uncertainty about the direction of the economy and the markets that would be associated with a period of relative market calm.

Historical volatility, therefore, should provide a volatility floor and with historical volatility currently unable to drop below the low to mid-20s, we should begin to see evidence of that volatility floor shortly. I have seen some investors call for the flood of liquidity to push the VIX under 20. I just don’t see it, at least for now. There is the possibility that stocks enter into an extended period of range-bound trading that brings volatility down to the low 20s, but I would be surprised to see a sub-20 VIX by the end of the year.

In 2007, the VIX ended the year at 22.50. While my crystal ball generally does not extend more than a month or two, my best guess is that we see the VIX in the 22.50 to 25.00 range at the end of 2009.
[source: StockCharts]
Monday, September 15, 2008

VIX Spikes and the 2002 Market Bottom

With the VIX spiking over 30 this morning and investors wondering if the markets will ever find a bottom, this seems like a good time to talk about VIX spikes and market bottoms. Specifically, I want to dispel the myth that bear markets have to end in some grand capitulation climax that includes a dramatic volatility spike.

A perfect counter example to the VIX spike requirement can be found in the bear market that followed the NASDAQ boom which crested in March 2000. In fact, with the exception of the current bear market, the 2000-2002 bear market is the only bear market since the launch of the VIX back in 1993 or the historical reconstruction of VIX data by the CBOE that dates back to 1990.

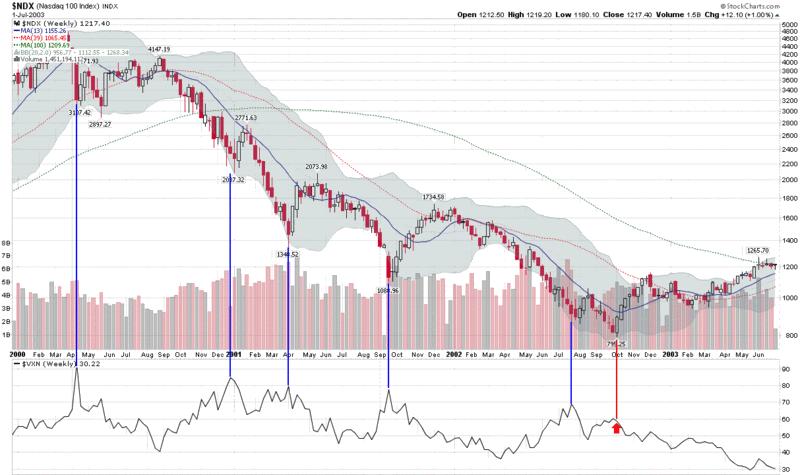
Rather than use the SPX and the VIX to demonstrate my point, the chart below uses the NASDAQ-100 index (NDX) and its companion volatility index, the VXN. The reason I chose the NDX is that from the March 24, 2000 peak (4816.35) to the October 8, 2002 bottom (795.25), the NDX lost an astonishing 83.5% of its value. If there was ever an opportunity to witness a dramatic drop and capitulation, this was the market and index in which to see it happen.

If one looks at a chart of the NDX and the VXN for the period 2000-2002, five distinct VXN spikes stand out. I have highlighted these with a blue vertical line for easy reference in the chart below. It turns out that those who went long at the time of these volatility spikes saw anywhere from two weeks of a bounce to several months of mostly sideways action. None of these spikes signaled a lasting market bottom.

When the NDX finally hit bottom (marked by the red vertical line and arrow), the VXN barely moved at all. Yes, the nastiest bear market of the last two decades ended with a volatility whimper. I like to call this type of bottoming action a "stealth bottom."

Capitulation comes in all shapes in sizes. Most bottoms are marked by a VIX spike. If, however, you assume that volatility spikes will mark the bottoms and bottoms cannot form without a VIX spike, you will be overlooking an important lesson from perhaps the most important recent bear market.

[source: StockCharts, VIX and More]

DISCLAIMER: "VIX®" is a trademark of Chicago Board Options Exchange, Incorporated. Chicago Board Options Exchange, Incorporated is not affiliated with this website or this website's owner's or operators. CBOE assumes no responsibility for the accuracy or completeness or any other aspect of any content posted on this website by its operator or any third party. All content on this site is provided for informational and entertainment purposes only and is not intended as advice to buy or sell any securities. Stocks are difficult to trade; options are even harder. When it comes to VIX derivatives, don't fall into the trap of thinking that just because you can ride a horse, you can ride an alligator. Please do your own homework and accept full responsibility for any investment decisions you make. No content on this site can be used for commercial purposes without the prior written permission of the author. Copyright © 2007-2023 Bill Luby. All rights reserved.
 
Web Analytics