Volatility During Crises
[The following first appeared in the August 2011 edition of Expiring Monthly: The Option Traders Journal. I thought I would share it because it might help some readers put the current fiscal cliff crisis in historical context.]
The events of the last three weeks are a reminder that financial crises and stock market volatility can appear almost instantaneously and mushroom out of control before some investors even have a chance to ask what is happening. A case in point: on August 3rd investors were breathing a sigh of relief after the United States had finalized an agreement to raise the debt ceiling; at that time, the VIX stood at 23.38, reflecting a relative sense of calm, yet just three days later, the VIX jumped to 48.00 as two new crises displaced the debt ceiling issue.
Spanning the globe from Northern Africa, Japan, Europe and the United States, 2011 has seen no shortage of crises in the first eight months of the year. Given this pervasive crisis atmosphere, it is reasonable for investors to consider how much volatility they should anticipate during a crisis. In this article I will attempt to put crises and volatility in some historical perspective and address a variety of factors that affect the magnitude and duration of volatility during a crisis, drawing upon fundamental, technical and psychological causes.
Volatility in the Twentieth Century
Every generation likes to think that the issues of their time are more daunting and more complex than those faced by prior generations. No doubt investors fall prey to this kind of thinking as well. With a highly interconnected global economy, a news cycle that races around the globe at the speed of light and high-frequency and algorithmic trading systems that have transferred the task of trading from humans to machines, there is a lot to be said for the current batch of concerns. Looking at just the first half of the twentieth century, however, investors had to cope with the Great Depression, two world wars and the dawn of the nuclear age.
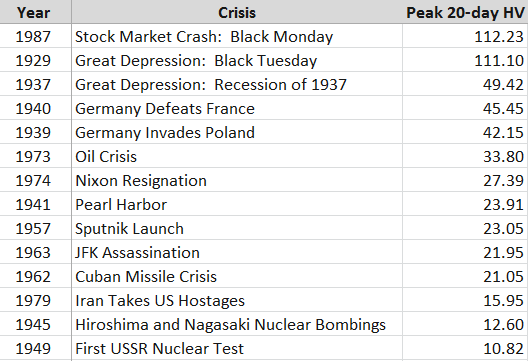
Given that the CBOE Volatility Index (VIX) was not launched until 1993, any evaluation of the volatility component of various crises prior to the VIX must rely on measures of historical volatility (HV) rather than implied volatility. As the S&P 500 index on which the VIX is based only dates back to 1957, I have elected to use historical data for the Dow Jones Industrial Average dating back to before the Great Depression. In Figure 1 below, I have collected peak 20-day historical volatility readings for selected crises from 1929 to the present.
Before studying the table, readers may wish to perform a quick exercise by making a mental list of some of the events of the 20th century that constituted immediate or deferred threats to the United States, then compare the magnitude of that threat with the peak historical volatility observed in the Dow Jones Industrial Average. If you are like most historians and investors, after looking at the data you will probably conclude that the magnitude of the crisis and the magnitude of the stock market volatility have at best a very weak correlation.
[source(s): Yahoo]
Any ranking of crises in which the Cuban Missile Crisis and the attack on Pearl Harbor rank in the lower half of the list is certain to raise some eyebrows. Frankly I would have been surprised if even one of these events failed to trigger a historical volatility reading of 25, but seeing that was the case for half the crises on this list certainly provides a fair amount of food for thought.
Volatility in the VIX Era
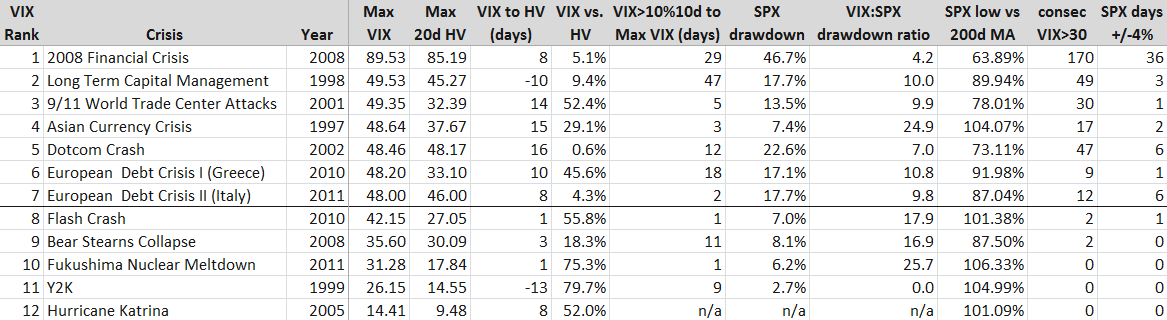
With the launch of the VIX it became possible not only to evaluate historical volatility, but implied volatility as well. With only 18 years of data to draw upon, there is a limited universe of crises to examine, so in the table in Figure 2 below, I have highlighted the seven crises in the VIX era in which intraday volatility has reached at least 48. Additionally, I have included five other crises with smaller VIX spikes for comparison purposes.
[source(s): CBOE, Yahoo]
[Some brief explanatory notes will probably make the data easier to interpret. First, the crises are ranked by maximum VIX value, with the maximum historical volatility in an adjacent column for an easy comparison. The column immediately to the right of the MAX HV data captures the number of days from the peak VIX reading to the maximum 20-day HV reading, with negative numbers (LTCM and Y2K) indicating that HV peaked before the VIX did. The VIX vs. HV column calculates the amount in percentage terms that the peak VIX exceeded the peak HV. The VIX>10%10d… column reflects how many days transpired from the first VIX close above its 10-day moving average to the peak VIX reading. The SPX Drawdown column calculates the maximum peak to trough drawdown in the S&P 500 index during the crisis period, not from any pre-crisis peak. The VIX:SPX drawdown ratio calculates the percentage change in the VIX from the SPX crisis high to the SPX crisis low relative the percentage change in the SPX during the same period (of course these are not necessarily the VIX highs and lows during the period.) The SPX low relative to the 200-day moving average is the maximum amount the SPX fell below its 200-day moving average during the crisis. Finally, the last two columns capture the number of consecutive days the VIX closed at or above 30 during the crisis and the number of days the SPX closed at least 4% above or below the previous day’s close during the crisis.]
Looking at the VIX era numbers, it is not surprising that the financial crisis of 2008 dominates in many of the categories. Reading across the rows, one can get an interesting cross-section of each crisis in terms of various volatility metrics, but I think some of the more interesting analysis comes from examining the columns, where we can learn something not just about the nature of the crises, but also about volatility as well. One important caveat is that the limited number of data points does not allow for this to be a statistically valid sample, but that does not preclude the possibility of drawing some potentially valuable and actionable conclusions.
Looking at the peak VIX reading relative to the peak HV reading I note that in all instances the VIX was ultimately higher than the maximum 20-day historical volatility reading. In the five lesser crises, the VIX was generally 50-80% higher than peak HV. In the seven major crises, not surprisingly HV did approach the VIX in several instances, but in the case of the 9/11 attack and the 2010 European sovereign debt crisis the VIX readings grossly overestimated future realized volatility.
One of my hypotheses about the time between the first VIX close above its 10-day moving average and the ultimate maximum VIX reading was that the longer the period between the initial VIX breakout and the maximum VIX, the higher the VIX spike would be. In this case the Long-Term Capital Management (LTCM) and 2008 crises support the hypothesis, but the data is spotty elsewhere. The current European debt crisis, Asian Currency Crisis of 1997 and 9/11 attack all reflect a very rapid escalation of the VIX to its crisis high. In the case of the May 2010 ‘Flash Crash’ and the Fukushima Nuclear Meltdown, the maximum VIX reading happened just one day after the initial VIX breakout. As many traders use the level of the VIX relative to its 10-day moving averages as a trading trigger, the data in this column could be of assistance to those looking to fine-tune entries or better understand the time component of the risk management equation.
Turing to the SPX drawdown data, the Asian Currency Crisis stands out as one instance where the VIX spike seems in retrospect to be out of proportion to the SPX peak to trough drawdown during the crisis. On the other side of the ledger, the drawdown during the Dotcom Crash appears to be consistent with a much higher VIX reading. Here the fact that it took some 2 ½ years for stocks to find a bottom meant that when the market finally bottomed, investors were somewhat desensitized and some of the fear and panic had already left the market, which is similar to what happened at the time of the March 2009 bottom. Note that the median VIX:SPX drawdown ratio for all twelve crises is 10.0, which is about 2 ½ times the movement in the VIX that one would expect during more normal market conditions.
The data for the SPX Low vs. 200-day Moving Average is similar to that of the SPX drawdown. For the most part, any drawdown of 10% or more is likely to take the index below its 200-day moving average. In the seven major crises profiled above, all but the Asian Currency Crisis dragged the index below its 200-day moving average; on the other hand, in all but one of the lesser crises the SPX never dropped below its 200-day moving average. Based on this data at least, one might be inclined to include the 200-day moving average breach as one aspect which helps to differentiate between major and minor crises.
As I see it, the last two columns – consecutive days of VIX closes over 30 and number of days in which the SPX has a 4% move – are central to the essence of the crisis volatility equation. Since the dawn of the VIX, the SPX has experienced a 2% move in about 80% of its calendar years, the VIX has spiked over 30 about 60% of the years, and the SPX has seen at least one 4% move in about 40% of those years. Those 4% moves are rare enough so that they almost always occur in the context of some sort of major crisis. In fact, one could argue that a 4% move in the SPX is a necessary condition for a financial crisis and/or a significant volatility event.
Fundamental, Technical and Psychological Factors in Crisis Volatility
Crises have many different causes. In the pre-VIX era, we saw a mix of geopolitical crises and stock market crashes, where the driving forces were largely fundamental ones. During the VIX era, I would argue that technical and psychological factors become increasingly important. The rise of quantitative trading has given birth to algorithmic trading, high-frequency trading and related approaches which place more emphasis on technical data than fundamental data. At the same time, retail investing has been revolutionized by a new class of online traders and the concomitant explosion in self-directed traders. This increased activity at the retail level has added a new layer of psychology to the market.
In terms of fundamental factors, one could easily argue that the top nine VIX spikes from the list of VIX era crises all arise from just two meta-crises, whose causes and imperfect resolution has created an interconnectedness in which subsequent crises are to a large extent just downstream manifestations of the ripple effect of the original crisis.
The first example of the meta-crisis effect was the 1997 Asian Currency Crisis, which migrated to Russia in the form of the 1998 Russian Ruble Crisis, which played a major role in the collapse of Long-Term Capital Management.
The second example of meta-crisis ripples begins with the Dotcom Crash and the efforts of Alan Greenspan to stimulate the economy with ultra-low interest rates. From here it is easy to draw a direct line of causation to the housing bubble, the collapse of Bear Stearns, the 2008 Financial Crisis and the recurring European Sovereign Debt Crisis. In each case, the remedial action for one crisis helped to sow the seeds for the next crisis.
In addition to the fundamental interconnectedness of these recent crises, it is also worth noting that the lower volatility crises were largely point or one-time-only events. There was, for instance, only one Hurricane Katrina, one turn of the clock for Y2K and one earthquake plus tsunami in Japan. As a result, the volatility associated with these events was compressed in time and accordingly the contagion potential was limited. By contrast, the major volatility events are more accurately thought of as systemic threats that ebbed and flowed over the course of an extended period, typically with multiple volatility spikes. In the same vein, the attempted resolution of these events generally included a complex government policy cocktail, whose effects were gradual and of largely indeterminate effectiveness.
Apart from the fundamental thread running through these crises, I also believe there is a psychological thread that sometimes spans multiple crises. Specifically, I am referring to the shadow that one crisis casts on future crises that follow it closely in time. I call this phenomenon ‘disaster imprinting’ and psychologists characterize something similar as availability bias. Simply stated, disaster imprinting refers to a phenomenon in which the threats of financial and psychological disaster are so severe that they leave a permanent or semi-permanent scar in one’s psyche. Another way to describe disaster imprinting might be to liken it to a low-level financial post-traumatic stress disorder. Following the 2008 Financial Crisis, most investors were prone to overestimating future risk, which is why the VIX was consistently much higher than realized volatility in 2009 and 2010.
While it is impossible to prove, my sense is that if the events of 2008 were not imprinted in the minds of investors, the current crisis atmosphere might be characterized by a much lower degree of volatility and anxiety.
Conclusion
As this goes to press, the current volatility storm is drawing energy from concerns about the European Sovereign Debt Crisis as well as fears of a slowdown in global economic activity. The rise in volatility has coincided with a swift and violent selloff in stocks that has seen six days in which the S&P 500 index has moved at least 4% either up or down – a rate that is unprecedented outside of the 2008 Financial Crisis.
Ultimately, the severity of a volatility storm is a function of both the magnitude and the duration of the crisis, as well as the risk of contagion to other geographies, sectors and institutions. Act I of the European Sovereign Debt Crisis, in which Greece played the starring role, can trace its origins back to December 2009. In the intervening period, it has spread across Europe and has sent shockwaves across the globe.
By historical standards the volatility aspect of the current crisis is more severe than at any time during World War II, the Cuban Missile Crisis and just about any crisis other than the Great Depression, Black Monday of 1987 and the 2008 Financial Crisis.
In the data and commentary above, I have attempted to establish some historical context for volatility during various crises extending back to 1929 and in the process give investors some metrics for evaluating current and future volatility spikes. In addition, it is my hope that concepts such as meta-crises and disaster imprinting can help to bolster the interpretive framework for investors who are seeking a deeper understanding of volatility storms and the crises from which they arise.
Related posts:
- The Biggest VIX Spike Ever: A Retrospective
- VIX Sets Some New Records, Suggesting Volatility Near Peak
- Highest Intraday VIX Readings
- Short-Term and Long-Term Implications of the 30% VIX Spike
- VIX Spike of 35% in Four Days Is Short-Term Buy Signal
- Lessons from the Post-2/27 VIX Price Action
- VIX Approaches Pre-2008 Record Highs
- VXO Chart from 1987-1988 and Explanation of VIX vs. VXO
- Volatility History Lesson: 1987
- Chart of the Week: VXV and Systemic Failure
- Forces Acting on the VIX
- A Conceptual Framework for Volatility Events
Disclosure(s): none