VIX Jumps 10% on Consecutive Days
In most of the world, yesterday’s big news was that the S&P 500 index fell 5% for the second day in a row. Here at VIX Central, I was also interested to note that the VIX jumped 10% for the second day in a row, something that has happened on nine previous occasions going back to 1990.
From a market timing perspective, the history of consecutive double digit jumps in the VIX does show a significant bullish bias going forward, but not one that develops until after the first day. In the graphic below, courtesy of Yahoo, I have also put these nine double jumps into historical perspective by marking them with blue arrows. These double jump days do tend to appear at important inflection points, but these are not necessarily at reversals, nor are they necessarily associated with bull markets. On balance, however, I would consider this double jump VIX activity to be a bullish development.
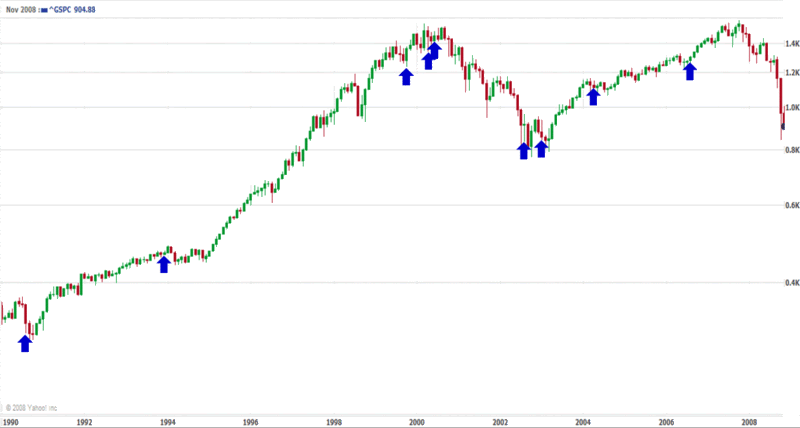
[source: Yahoo]


11 comments:
....going up
http://www.flickr.com/photos/31205984@N04/3010957834/sizes/o/
...a view of the last 6 months
http://www.flickr.com/photos/31205984@N04/3010938696/sizes/o/
bill,
seems short term bullish. alot of the later bars on the chart after these jumps were lower after a bounce would you agree ?
I agree that on balance this is a bullish signal. Frankly, I would have guessed that it would be more bullish, but the two signals near the 2000 top and again slightly ahead of the 2002 lows bring down the overall numbers.
First movement will be down
http://www.flickr.com/photos/31205984@N04/3018341477/sizes/l/
The last candle was Black Marubozu,
but the down movement wont be very deep (as the indicators show on the daily frame)
http://www.flickr.com/photos/31205984@N04/3019185662/sizes/l/
Dark Cloud Cover
http://www.flickr.com/photos/31205984@N04/3018483465/sizes/o/
The Dark Cloud Cover didn't find confirmation (confirmation strictly required 4 that bearish pattern), mine indicators told me the true there was much room up than down
http://www.flickr.com/photos/31205984@N04/3019279433/sizes/l/
Aut Caesar Aut Nullius
Lapsus calami:
"Aut Caesar Aut Nullus"
I looked over the 10+ years data I had and found this to be a rare pattern and useful at that.
Post a Comment