Fifty Day Historical Volatility Rolling Over?
Something interesting happened yesterday that has happened very rarely over the past two months or so: 50 day historical volatility (HV) in the S&P 500 index dropped. While that fact in itself might not be worth of a headline next to the latest installment of ‘Adventures in TARPland,’ there is a strong possibility that historical volatility in the SPX has just peaked.
Actually the 10 day version of historical volatility for the SPX peaked back on October 22nd, followed by the 20 and 30 day HV topping out on November 5th and November 7th. It is too early to say definitively that 50 day historical volatility will not exceed Friday’s high, but the odds are in favor of it, as it is only a couple more days before the Lehman-powered selloff of September 15th scrolls off of the 50 day lookback window.
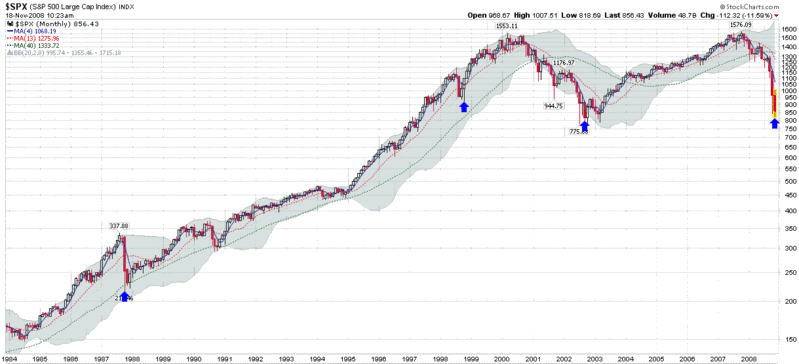
Now I’m sure this bit of volatility trivia is not likely to excite readers, so I have included a chart below which shows the last three times 50 day historical volatility in the SPX has peaked at a level of 30 or higher. While all three previous instances (marked by the blue arrows) have turned out to be excellent buying opportunities, finding historical parallels to help interpret the current market situation has lately been an approach fraught with danger.
A better way to think about historical volatility rolling over is that like the VIX, historical volatility is a barometer of some of the uncertainty and emotional components of the markets. As these readings begin to pull back from recent highs, investors of all persuasions are more likely to enter the markets.

[source: StockCharts]


3 comments:
Good detective work! Nice chart.
Great observation. Will keep an eye out for dipping in for some long positions.
Thanks for the analysis
a little closer up, vix does seem to be topping. I would hope to see a some drama and a turn to to make the trade easy.
vix chart
Longer term, this remarkable vix activity feels like a sentiment breakout. I suspect that the final bottom in the market, when it comes, will come on a vix much lower than where it is today.
Post a Comment