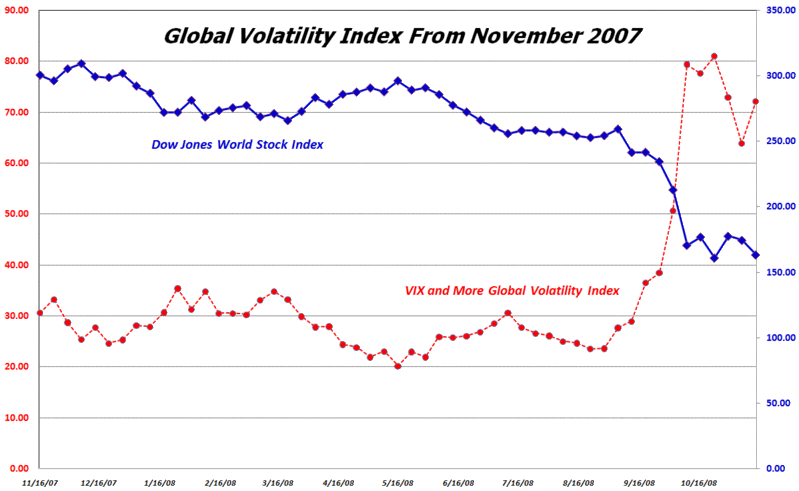
Introducing the VIX and More Global Volatility Index
As representatives of the G20 assemble in Washington to discuss the state of the global economy, this seems like a good time to take the wraps off of the VIX and More Global Volatility Index.
Without getting into all the details, the Global Volatility Index calculates a weighted average of the implied volatility in options for equities in the 15 largest global economies, which represent approximately 76% of the world’s economic activity.
To the best of my knowledge, this index is the first of its kind, with previous volatility indices limited to country-specific volatility or in the case of the VSTOXX, to the Eurozone area.
The chart below plots the Global Volatility Index against the Dow Jones World Stock Index over the course of the past year. The Global Volatility Index opens up many new areas of analysis and interpretation of the markets and I will talk more about these in this space in the coming weeks.

[source: VIX and More]


6 comments:
Bill - any chance you can send us quantitative types some historical data to play with?
Hi Michael,
A good question. I plan to keep the historical data under wraps at least until the beginning of 2009. I'd like to see how this feature is received before I make any policy decisions about releasing the data.
That being said, thanks to you and to the others who have inquired about the Global Volatility Index for expressing your interest. I am very much pro-sharing, so this is by no means a slam dunk decision for me.
Cheers,
-Bill
The new $GDOW is a very interesting index. The list of companies alone shows some real insight, and the fact it isn't capitalization-weighted is also insightful.
It's an index I would invest in, and I'm sure I'll soon have an opportunity to do so in ETF style.
Does volatility for non cap-weighted indexes require anything different?
Ryan Detrick of Schaeffers Research stated earlier this morning that;
"This week is expiration week, a period that has historically been bullish for the market. This fact, coupled with the SPX trading near the bottom of its trading range, could be a very good sign for the market. As Rocky White pointed out in An Historical Look at Expiration-Week Returns, the past 34 expiration weeks have posted an average return of 0.66%. Also, more than 70% of these weeks have been positive. This is an extremely bullish configuration when compared to non-expiration weeks, which have finished positive only about 46% of the time, with an average return of -0.40%.
Given this information, it seems likely that a short-term rally is possible. From a long-term perspective, however, I don't think we've seen our ultimate lows. As Todd Salamone has mentioned during the past few months, there is fear in this market, but not nearly enough to signal the end of a bear market. In fact, last week we saw a record jump in S&P 500 small traders' positions, according to the Commitment of Traders report. Couple this report with the large moves in numerous investor sentiment polls following the recent market bounce, and I think there is still too much optimism for an ultimate bottom to have formed."
Based on the extreme intraday volatlity that transpired in the markets recently, it should be an interesting week.
Hi Tom,
Thanks for the heads up on the GDOW. I am still waiting for a global index that I can get excited about...
Regarding volatility for an index that is not weighted by market cap, I am not sure if there is an easy way to adjust for this. The actual volatility calculations would be the same -- at least as I see it -- except that the result would be a little different.
Ultimately, I am more interested in the change in volatility for a given basket of stocks than whether I am comparing a basket of identically sized apples and oranges to ones whose sizes are naturally distributed.
Cheers,
-Bill
Definitely worth looking since the global behavior are now pretty much correlated at this time.
Post a Comment