Showing posts with label VSTOXX. Show all posts

Tuesday, May 2, 2017

Euro Zone VSTOXX ETNs Land on U.S. Beaches!

Think the market is too complacent about this weekend’s election in France?  Worried that the euro area is going to crumble under the weight of Italy’s struggles?  Convinced that Greece, Portugal or Spain are just one more kicked can away from a disaster?

As of tomorrow, investors in the U.S. will have another way to translate these ideas into actionable trades with tomorrow’s launch of two new exchange-traded notes (ETNs) – EVIX (long euro zone volatility) and EXIV (inverse euro zone volatility) – from VelocityShares and UBS that put a European face on existing U.S. VIX-based products such as VIIX and perennial favorite XIV.

Based on the VSTOXX, the VIX-like volatility index for the EURO STOXX 50 Index of 50 blue-chip stocks from 11 euro zone countries, EVIX and EXIV should be familiar to those who are knowledgeable about VXX and VIIX on the long volatility side as well as XIV and SVXY on the short volatility side.  EVIX and EXIV are based on VSTOXX futures and have a target maturity of 30 days – a maturity that is maintained by rolling a portion of the portfolio each day and therefore subjecting both products to the vagaries of contango and backwardation.  In the event these are terms you are not familiar with, I strongly recommend that you click on the links above and educate yourself.  Believe it or not, this is the ninth year I have been talking about the VIX futures term structure, negative roll yield, contango and backwardation.  (Those who have been paying attention since the early days of VXX and VXZ have no doubt profited mightily from this knowledge.)

The beauty of EVIX and EXIV is that these products create so much flexibility for investors who maintain a global, cross-asset class view of volatility.  In the run-up to the first round of the French election, for example, VSTOXX spiked dramatically and pushed the VSTOXX:VIX ratio below 1.00, creating some interesting arbitrage opportunities and/or pairs trades in the process.  Now investors can trade euro zone volatility against U.S. volatility, use targeted hedges for risk that is specific to the euro zone or speculate more easily about the direction of volatility in the euro zone.

I encourage everyone to study the EVIX and EXIV prospectus closely.

This is a huge development in the volatility space and if options on EVIX and EXIV follow later this week, as expected, the volatility trading landscape will be much richer and more diverse. 

Now if we can only get liquid volatility products for gold volatility (GVZ) and crude oil volatility (OVX), I won’t even have to set out a stocking next to the chimney this Christmas.

While I’m at it, why are there no options on XIV?  This is such a popular high-beta product that it deserves options so traders can express a broader range of opinions on volatility.  Readers, it never hurts to nudge the CBOE on these issues.  An outpouring of popular sentiment can make a difference.

As the risk of charging off into full rant mode, I feel compelled to say that I hope volatility investors know a good thing when they see it.  It is a shame that VXST futures did not attract enough attention to hang around and that VMAX and VMIN are not trading with higher volumes.  One of the best volatility products ever created, ZIV, nearly died of neglect before investors finally paid it some attention.

As I see it, EVIX and EXIV as well as VMAX and VMIN are test cases for the future of the breadth of volatility products.  If you would like a diverse tapestry of volatility products in the future, it would not hurt to “buy local” volatility ETPs rather than sticking to the handful of already successful products.  If you don’t vote with your feet, you had better be happy playing in a small and rather limited sandbox.  I am fond of saying, “In volatility, there is opportunity!” – but that opportunity is a function of the richness of the various volatility product platforms.

Last but not least, I know Eurozone and eurozone are the preferred spellings, but I am sticking to the two-word “euro zone” with as much stubbornness as I can muster.  What can I say, I am short convention…

Further Reading:

For those who may be interested, you can always follow me on Twitter at @VIXandMore

Disclosure(s): net short VXX and VMAX; net long XIV and ZIV at time of writing.  The CBOE is an advertiser on VIX and More.

Tuesday, July 16, 2013

Guest Columnist at The Striking Price for Barron’s: How to Spot Risk Early

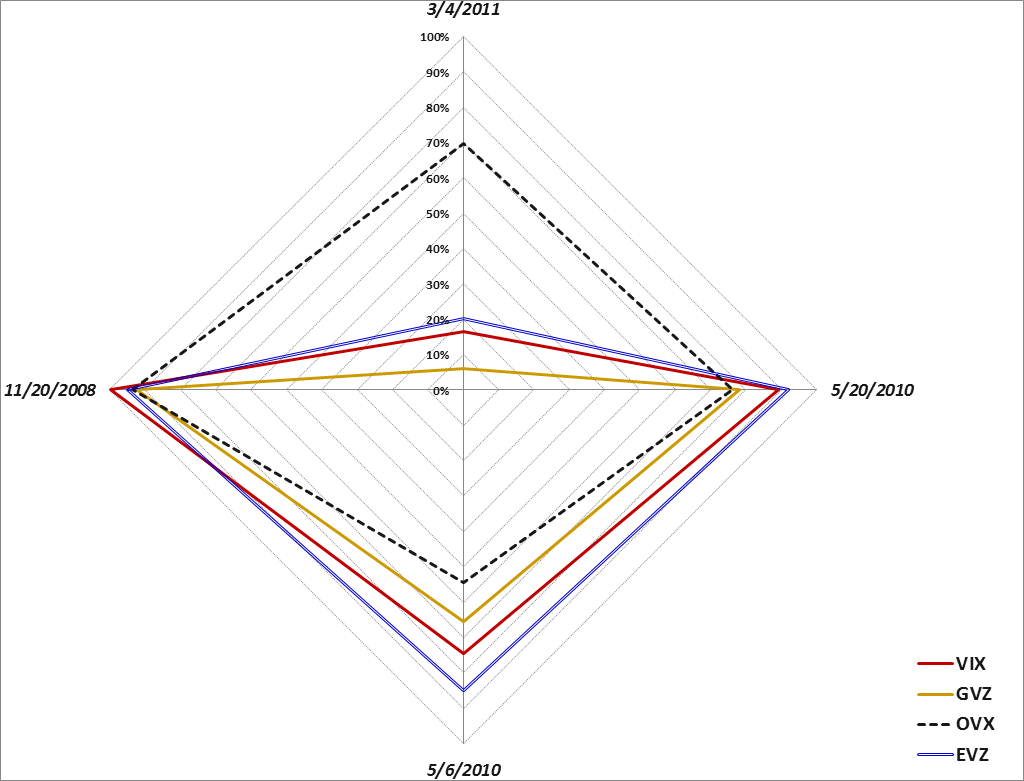
Today’s guest column, How to Spot Risk Early, at The Striking Price on behalf of Steven Sears at Barron’s, is the eleventh time I have had the opportunity to write a column for Barron’s. Today’s column picks up on a theme I addressed in a March 2011 article in Expiring Monthly which was titled, Evaluating Volatility Across Asset Classes. In that 2011 article, I introduce the concept of a volatility compass as a framework for evaluating the different types of volatility spikes that were seen in the 2008 financial crisis, the euro zone crisis as of May 2010, the Arab Spring in March 2011, and the May 6, 2010 flash crash.

[Volatility compass showing different levels of volatility across asset classes during four recent spikes in volatility. Source(s):VIX and More]

In the 2011 article I provide an overview of my thinking as follows:

“It is my belief that a better understanding of the volatility picture across asset classes will yield a better grasp of volatility events and help to identify a number of favorable trading setups.”

Later on I conclude the article with the following thoughts:

“For those who have studied sector rotation strategies and methods for trading geography-based ETFs, some of the analytical techniques used in those two disciplines can be carried over to an analysis of cross asset class volatility.

Ultimately, the study of volatility has both a science and art component to it, but a cross asset class approach provides a more broad-based holistic view of the volatility landscape and adds a little more science to the mix.

At some point, volatility becomes the study largely of contagion and falling dominoes. I can say without hesitation that a multi-disciplinary approach is essential to understanding contagion and dominoes and that a cross asset class analytical framework supplemented by tools such as the volatility compass is an effective way to approach that subject.”

In today’s Barron’s article, I expand upon the idea of four types of volatility indices and address volatility indices that provide a snapshot of geographical uncertainty and risk as well as broader measures of uncertainty and risk across asset classes such as U.S. Treasury Notes and currencies.

I will have more on this subject in the future, but for those interested in researching some of these subjects, I have highlighted some previous posts on different ways of thinking about uncertainty, risk and volatility below.

Related posts:

A full list of my Barron’s contributions:

Disclosure(s): none

Thursday, June 28, 2012

The Evolution of European Equity Risk

There are many ways in which investors can evaluate risk related to the euro zone. Credit default swaps for sovereign debt are one way to evaluate the risk of country default. Sovereign bond yields are a good proxy for a country’s access to funding via the credit markets. The euro crosses and related directional moves are a barometer of the strength of the currency and the euro zone countries as a whole, while various Intrade contracts can lend a sense of the probabilities that investors assign to various events, such as to the risk of one or more countries dropping the euro.

On the volatility side, the VSTOXX (EURO STOXX 50 Volatility Index) the EVZ (CBOE EuroCurrency Volatility Index) provide a market assessment of risk and uncertainty in euro zone stocks as well as the currency.

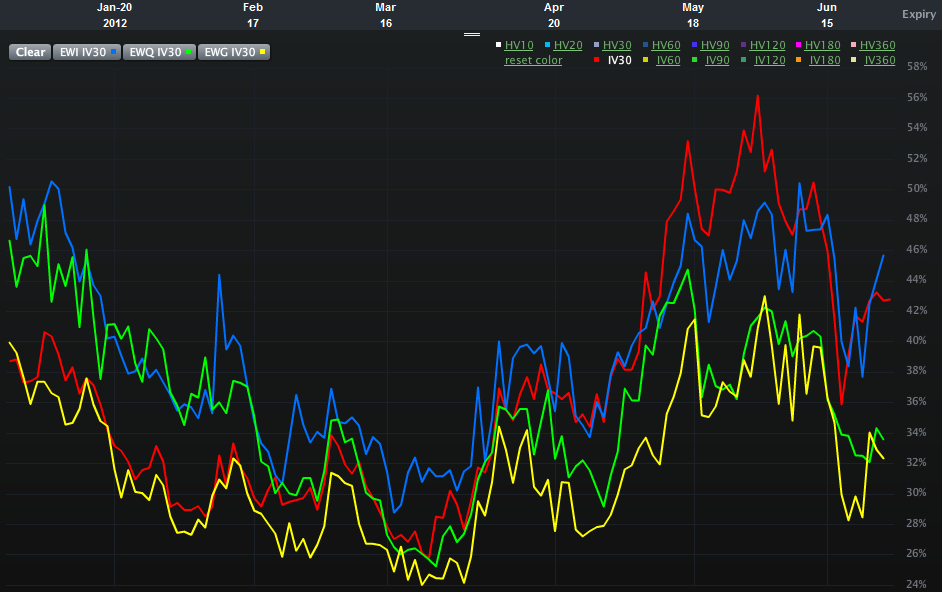
One piece of analysis I have not seen, however, is an assessment of the relative risk and uncertainty for equity markets in some of the more important euro zone nations. Specifically, Spain, Italy, France and Germany. The chart below attempts to offer up that very information, using 30-day implied volatility for the various country ETFs over the course of the past six months:

  • EWP – Spain (red line)
  • EWI – Italy (blue line)
  • EWQ – France (green line)
  • EWG – Germany (yellow line)

Looking at the chart, what initially catches my eye is the recent evolution of the two-tiered risk system. In the first half of the year, the higher risk is clearly associated with Italy and France, whereas Spain and Germany appear to be considerably less risky in terms of implied volatility. By the March the risk appears to have lessened across the board and the distinctions between individual countries is more difficult to discern. Over the course of the last 1 ½ months or so, a new two-tiered system has appeared. This time around it is Italy and Spain where the risk to equities is considered to be the greatest, with France now joining Germany in the lower risk tier.

In essence, Italy has persisted in the high risk tier and Germany has been a constant in the lower risk category. Over the course of the past few months, the interesting development has been the switch between France and Spain, with the former improving from being a peer of Italy to a peer of Germany, while Spain has moved in the opposite direction.

One could certainly argue that all four countries are in the same boat (taking on water, with shoddy life preservers, in shark-infested waters and being one small mutiny away from having no captain…), but clearly investors think there are important distinctions to be made in terms of equity risk and uncertainty. Perhaps of more interest, these fortunes appear to be shifting, with little perceptible difference not just between Spain and Italy, but also between Germany and France.

Related posts:

[source(s): LivevolPro.com]

Disclosure(s): Livevol is an advertiser on VIX and More

Wednesday, June 27, 2012

Euro Volatility and Risk

With the euro zone summit looming, investors are scrambling to find all sorts of measuring sticks to evaluate the risks of a sharp move in the financial markets. Based on some of the emails I have received, many are skeptical of the VIX right now, which is trading in the mid 19s, some 5% below its lifetime mean. At 27.54, the VSTOXX (EURO STOXX 50 Volatility Index) is showing much more uncertainty, but even that number is low relative to the range of the VSTOXX for the past three months.

Whether Spain, Italy or Greece is the fixation du jour, the questions investors really want answers to ultimately all cluster around the future of the euro. I have addressed this question relative to the risk of one or more countries leaving the euro in the context of various Intrade contracts (see links below), but another overlooked manner of measuring risk and uncertainty in the euro is the CBOE EuroCurrency Volatility Index (EVZ). Sometimes referred to as the “euro VIX,” EVZ uses the VIX methodology to measure the market’s expectations of future volatility in the euro. In theory, therefore, EVZ should also be a proxy for risk and uncertainty in the euro. One might even go as far as to consider EVZ as a euro zone fear indicator.

So what is a chart of EVZ telling us on the eve of another euro zone summit?

The chart below shows that at 11.27, EVZ is currently in the lower portion of its range of 9.23 – 20.34 for the past year. Indeed EVZ is only in the 18th percentile of the range of values over the course of the past year. Also of interest, the current 20-day historical volatility of EVZ (60) is lower than the 180-day historical volatility measure (65) – as has been the case for the majority of the last six months. Last but not least, EVZ has been on a notable downtrend since June 18th.

Headlines aside, traders do not see a lot of currency risk in the euro right now, at least relative to the last year or so and as far as the 30-day forward-looking window defined by EVZ is concerned.

So if you think the VIX is depressed and understating market risk, don’t expect the EVZ to be signaling something different. Currency risk and uncertainty seem surprisingly low at current levels. If you think the market has underpriced the potential for a large move in the euro, then consider some long straddles on the euro or its ETF counterpart, FXE.

Related posts:

[source(s): LivevolPro.com]

Disclosure(s): Livevol is an advertiser on VIX and More

Monday, May 14, 2012

Handicapping the Chances of Greece Dropping the Euro

Understanding all the moving parts in the European sovereign debt crisis can be a Herculean task, even for the most determined analyst. Heck, even hazarding a guess at what tomorrow’s crisis du jour will be is more than enough for most investors to grapple with.

In the case of Greece, with an ever-changing political party landscape and fickle voters who intend to distort that landscape even more, trying to assign probabilities to various scenarios and then divine the implications for Greece’s relationship with the euro is sufficiently daunting as to cause many an investor just to park their money in cash until the future begins to look a little less murky.

For some aspects of the euro zone fiasco, there are financial instruments and measures that can serve as a barometer of how bad things are now and are likely to become in the future. Credit default swaps are an excellent example, as is the VSTOXX equity volatility index, the euro volatility index (EVZ), sovereign debt yields, etc.

As far as the euro is concerned, the EVZ is relatively subdued at the moment. Over the course of its life (which began in November 2007), EVZ has typically traded at just a shade over half of the VIX, which is where it closed today. Still, while the VIX posted its highest close since January, EVZ was substantially higher during January, February and the beginning of March.

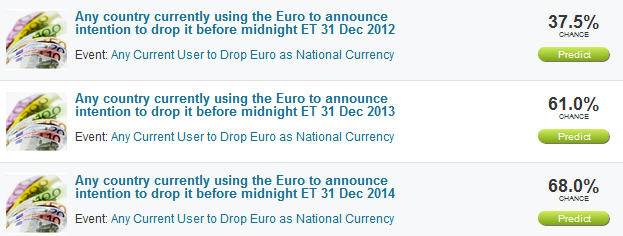
It is at times like this when I find myself paying more attention to the various Intrade prediction markets contracts. In the case of the euro, Intrade has three separate contracts based on the possibility that a euro zone member announces it will stop using the euro as its national currency. The three contracts have expiration dates of the end of 2012, 2013 and 2014 and currently indicate (see top graphic below) that the probability of any euro zone country announcing it will drop the euro is 37.5% by the end of 2012, 61% for the end of 2013 and 68% for the end of 2014.

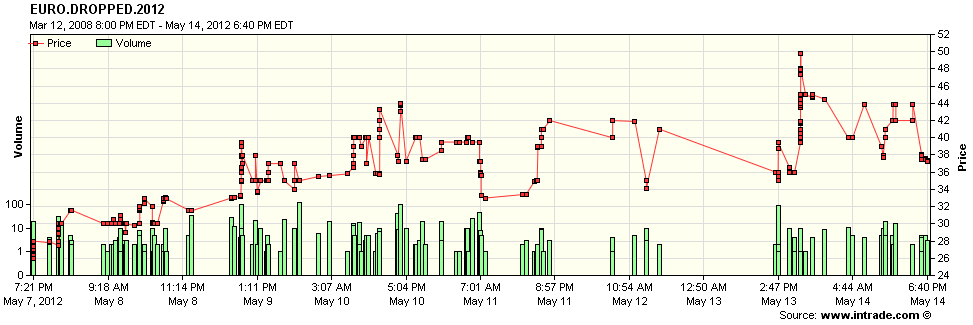
In addition to the probabilities derived from the price of these prediction market contracts, the trend also bears watching. The bottom graphic shows trades in the 2012 contract. Much to my surprise, sentiment that Greece (or any other country) will exit the euro this year apparently peaked (for now, at least) yesterday afternoon, and pulled back somewhat today, in choppy trading. For those who wish to watch this contract on a tick by tick basis, try the Advanced Charts option and click the Time and Sales radio button. Note that it is also possible to set alerts for this contract.

This seems like a good place to reiterate that I believe Intrade contracts, while helpful, are far from perfect. Still, if your talents do not include four dimensional euro zone dominoes in Greek, these prediction contracts can be a great shorthand for determining how certain events are likely to play out.

Related posts:

[source(s): Intrade.com]

Disclosure(s): none

Sunday, May 16, 2010

Chart of the Week: VSTOXX, VIX and the Risk of Global Contagion

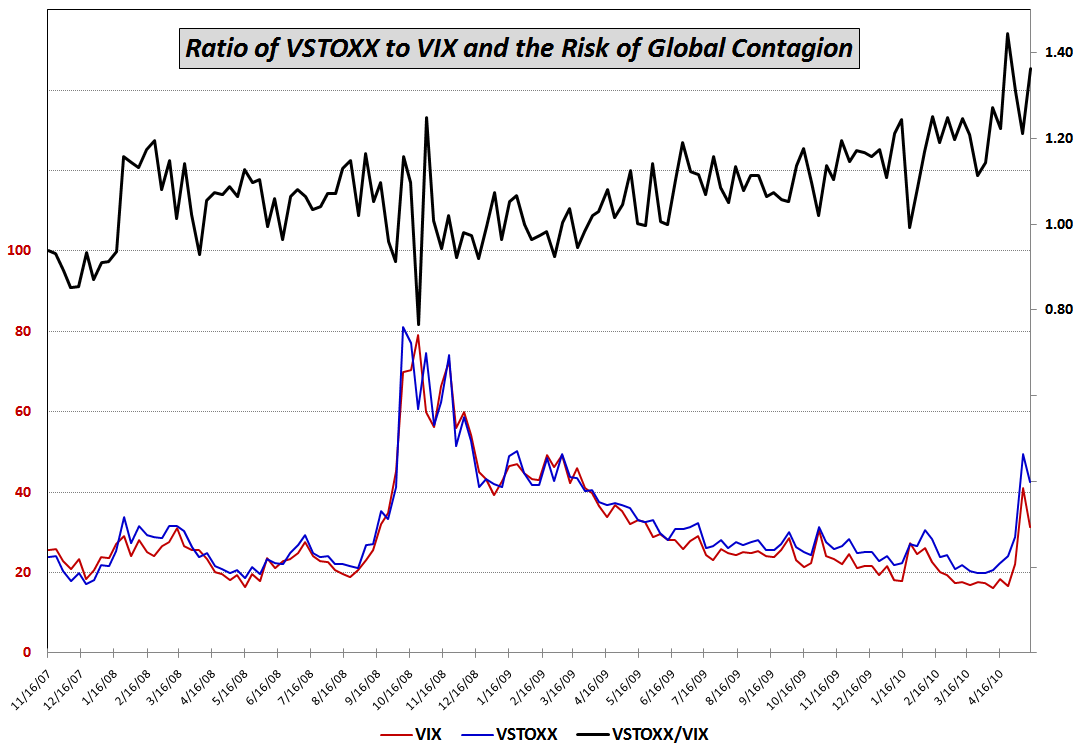
Several weeks ago, The New York Time ran an excellent graphic showing the interconnectedness of European debt in Europe’s Web of Debt. Other sources periodically trot out various charts of credit default swaps (CDS), but I have yet to see a graphic which attempts to measure the risk of global contagion.

This week’s chart of the week is an attempt to reduce a hypothesis about global contagion to a simple ratio chart. The hypothesis is that whereas the VIX is the best measure of uncertainty in the U.S. stock market and the VSTOXX (which is based on the EURO STOXX 50) is the best measure of uncertainty for euro zone stocks, the ratio of the VSTOXX to the VIX should capture the relative uncertainty for euro zone stocks vs. U.S. stocks. One would expect, therefore, that if VSTOXX is rising faster than the VIX, that options traders are expecting much higher uncertainty (and downside risk) in the euro zone than in the United States. This type of action would support a decoupling theory in which stock markets in the euro zone and the U.S. would begin to move independently of each other. On the other hand, should the VIX be rising at the same rate as VSTOXX, this would suggest that uncertainty and risk are roughly the same in the euro zone and the U.S. and that the risk of global contagion is relatively high.

The chart below is a weekly chart of VSTOXX and the VIX going back to November 2007, just after stocks peaked. Looking at the ratio during the past 2 ½ years, it shows that VSTOXX peaked relative to the VIX three weeks ago, pulled back dramatically up to last week, then surged up through Friday, where the ratio had its second highest weekly close. The verdict from the ratio seems to be that the risk of global contagion is high, slightly below the all-time high, but on the rise.

I will have more about the VSTOXX:VIX ratio going forward.

For more on related subjects, readers are encouraged to check out:


[source: STOXX, CBOE]

Disclosure(s): short VIX at time of writing

Tuesday, February 9, 2010

Are You Watching Greece?

Retail investors in the United States sometimes have difficulty staying on top of events and markets in Europe.

In the last week, I have suggested several ways to monitor the status of various pockets of interest in Europe, including Spain (via the iShares MSCI Spain Index ETF, EWP) and the euro. I certainly also could have included the VSTOXX, the volatility index tied to the Dow Jones STOXX 50 index of European companies.

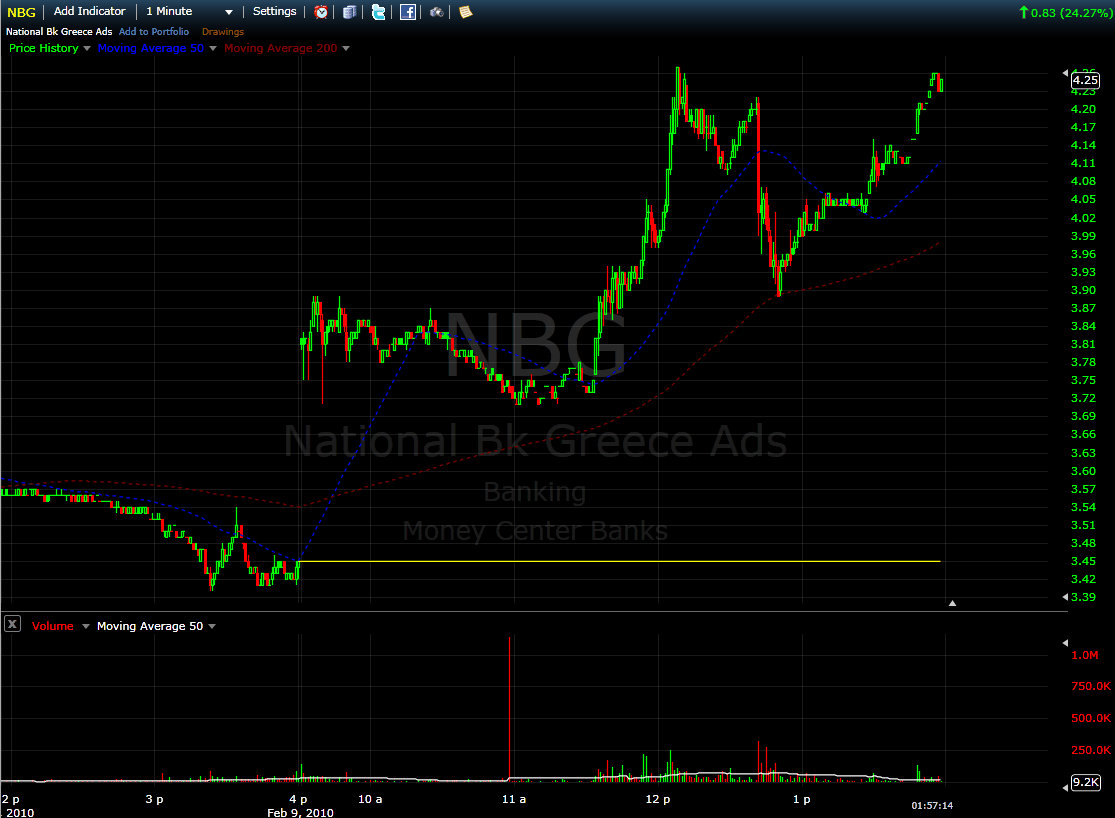
While I love proxies, ground zero for the European financial crisis is Greece, where ongoing discussions with European Union leaders, particularly those from Germany, are wrestling with the best way to balance national and regional interests.

There is not currently a Greek ETF, but as proxies for Greece go, the National Bank of Greece (NBG) is an excellent one. This bank trades millions of shares per day and has a market cap of $12.5 billion. So whether you just wish to take the temperature of the Greek financial situation or want to speculate on a particular outcome, NBG is a worthy addition to any watch list.

For related posts on these subjects, readers are encouraged to check out:


Disclosures: long NBG and EWP at time or writing

[source: FreeStockCharts.com]

Thursday, November 26, 2009

Dubai Debt Concerns Trigger Spikes in Foreign Volatility Indices

With the S&P 500 and NASDAQ futures both down approximately 3% as I type this on concerns about the ability of Dubai World to repay some $59 billion in debt, tomorrow’s half day session is likely to be ugly and volatile. In a vacuum, this type of event would be concerning, but not likely to cause panic. With the emotional scars of the financial crisis still looming large in the memories of investors (i.e., Availability Bias and Disaster Imprinting), I would not be surprised to see an overreaction in the markets tomorrow.

On average, a 3% drop in the SPX yields a spike of about 12.6% in the VIX. Yesterday the Dow Jones STOXX 50 index of European companies fell 3.36%, yet the VSTOXX, (the corresponding volatility index, which is similar to a pan-European VIX) spiked 28.16%.

For the record, a 28.16% increase in the VIX would put it at 26.25.

With the shortened trading session tomorrow providing below average liquidity and investors having an entire weekend to fret about possible contagion or additional cockroaches suddenly appearing, I am predicting a wild ride.

My general approach to events like this one is to try to fade the VIX spike as it shows signs of having topped, but there are frequently multiple spikes to contend with in these types of scenarios.

I will do the best I can to provide some commentary and analysis as the events of the Dubai World debt problems unfold.

In the interim, readers who are interested in previous posts on related subjects, readers are encouraged to check out:

Saturday, November 15, 2008

Introducing the VIX and More Global Volatility Index

As representatives of the G20 assemble in Washington to discuss the state of the global economy, this seems like a good time to take the wraps off of the VIX and More Global Volatility Index.

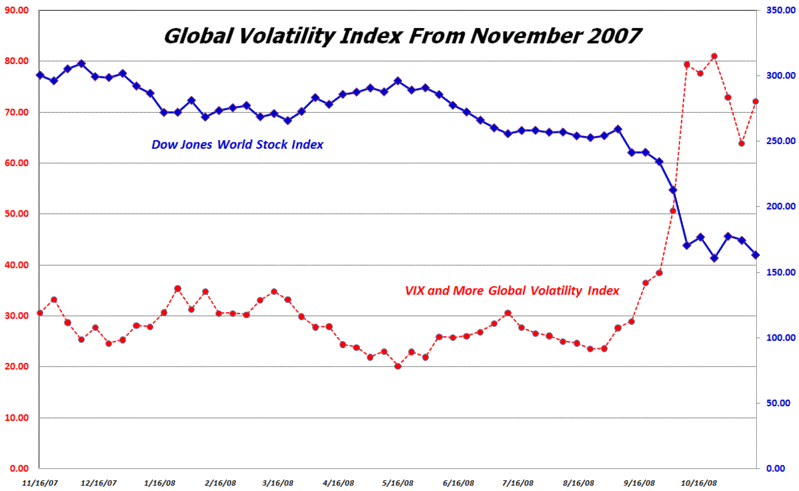
Without getting into all the details, the Global Volatility Index calculates a weighted average of the implied volatility in options for equities in the 15 largest global economies, which represent approximately 76% of the world’s economic activity.

To the best of my knowledge, this index is the first of its kind, with previous volatility indices limited to country-specific volatility or in the case of the VSTOXX, to the Eurozone area.

The chart below plots the Global Volatility Index against the Dow Jones World Stock Index over the course of the past year. The Global Volatility Index opens up many new areas of analysis and interpretation of the markets and I will talk more about these in this space in the coming weeks.

[source: VIX and More]

Tuesday, April 29, 2008

Ten Things Everyone Should Know About the VIX

I have had quite a few requests to present some introductory material on the VIX, so with that in mind I offer up the following in question and answer format:

Q: What is the VIX?
A: In brief, the VIX is the ticker symbol for the volatility index that the Chicago Board Options Exchange (CBOE) created to calculate the implied volatility of options on the S&P 500 index (SPX) for the next 30 calendar days. The formal name of the VIX is the CBOE Volatility Index.

Q: How is the VIX calculated?
A: The CBOE utilizes a wide variety of strike prices for SPX puts and calls to calculate the VIX. In order to arrive at a 30 day implied volatility value, the calculation blends options expiring on two different dates, with the result being an interpolated implied volatility number. For the record, the CBOE does not use the Black-Scholes option pricing model. Details of the VIX calculations are available from the CBOE in their VIX white paper.

Q: Why should I care about the VIX?
A: There are several reasons to pay attention to the VIX. Most investors who monitor the VIX do so because it provides important information about investor sentiment that can be helpful in evaluating potential market turning points. A smaller group of investors use VIX options and VIX futures to hedge their portfolios; other investors use those same options and futures as well as VIX exchange traded notes (primarily VXX) to speculate on the future direction of the market.

Q: What is the history of the VIX?
A: The VIX was originally launched in 1993, with a slightly different calculation than the one that is currently employed. The ‘original VIX’ (which is still tracked under the ticker VXO) differs from the current VIX in two main respects: it is based on the S&P 100 (OEX) instead of the S&P 500; and it targets at the money options instead of the broad range of strikes utilized by the VIX. The current VIX was reformulated on September 22, 2003, at which time the original VIX was assigned the VXO ticker. VIX futures began trading on March 26, 2004; VIX options followed on February 24, 2006; and two VIX exchange traded notes (VXX and VXZ) were added to the mix on January 30, 2009.

Q: Why is the VIX sometimes called the “fear index”?
A: The CBOE has actively encouraged the use of the VIX as a tool for measuring investor fear in their marketing of the VIX and VIX-related products. As the CBOE puts it, “since volatility often signifies financial turmoil, [the] VIX is often referred to as the ‘investor fear gauge’”. The media has been quick to latch onto the headline value of the VIX as a fear indicator and has helped to reinforce the relationship between the VIX and investor fear.

Q: How does the VIX differ from other measures of volatility?
A: The VIX is the most widely known of a number of volatility indices. The CBOE alone recognizes nine volatility indices, the most popular of which are the VIX, the VXO, the VXN (for the NASDAQ-100 index), and the RVX (for the Russell 2000 small cap index). In addition to volatility indices for US equities, there are volatility indices for foreign equities (VDAX, VSTOXX, VSMI, VX1, MVX, VAEX, VBEL, VCAC, etc.) as well as lesser known volatility indices for other asset classes such as oil, gold and currencies.

Q: What are normal, high and low readings for the VIX?
A: This question is more complicated than it sounds, because some people focus on absolute VIX numbers and some people focus on relative VIX numbers. On an absolute basis, looking at a VIX as reformulated in 2003, but using data reverse engineered going back to 1990, the mean is a little bit over 20, the high is just below 90 and the low is just below 10. Just for fun, using the VXO (original VIX formulation), it is possible to calculate that the VXO peaked at about 172 on Black Monday, October 19, 1987.

Q: Can I trade the VIX?
A: At this time it is not possible to trade the cash or spot VIX directly. The only way to take a position on the VIX is through the use of VIX options and futures or on two VIX ETNs that are based on VIX futures: VXX, which targets VIX futures with 1 month to maturity; and VXZ, which targets 5 months to maturity. An inverse VIX futures ETN, XXV, was launched on 7/19/10. This product targets VIX futures with 1 month to maturity. As of May 2010, options have been available on the VXX and VXZ ETNs.

Q: How can the VIX be used as a hedge?
A: The VIX is appropriate as a hedging tool because it has a strong negative correlation to the SPX – and is generally about four times more volatile. For this reason, portfolio managers often find that buying of out of the money calls on the VIX to be a relatively inexpensive way to hedge long portfolio positions. Similar hedges can be constructed using VIX futures or the VIX ETNs.

Q: How do investors use the VIX to time the market?
A: This is a subject for a much larger space, but in general, the VIX tends to trend in the very short-term, mean-revert over the short to intermediate term, and move in cycles over a long-term time frame. The devil, of course, is in the details.

[Last updated on 7/22/2010]

DISCLAIMER: "VIX®" is a trademark of Chicago Board Options Exchange, Incorporated. Chicago Board Options Exchange, Incorporated is not affiliated with this website or this website's owner's or operators. CBOE assumes no responsibility for the accuracy or completeness or any other aspect of any content posted on this website by its operator or any third party. All content on this site is provided for informational and entertainment purposes only and is not intended as advice to buy or sell any securities. Stocks are difficult to trade; options are even harder. When it comes to VIX derivatives, don't fall into the trap of thinking that just because you can ride a horse, you can ride an alligator. Please do your own homework and accept full responsibility for any investment decisions you make. No content on this site can be used for commercial purposes without the prior written permission of the author. Copyright © 2007-2023 Bill Luby. All rights reserved.
 
Web Analytics