Showing posts with label ZIV. Show all posts

Tuesday, March 29, 2022

UVIX and SVIX Join the VIX-Based ETP Landscape

Tomorrow will see first launch in the VIX ETP space since…well I’m not sure exactly, but I’m guessing the May 2016 launch of the now defunct VMIN and VMAX products.  Back in 2016, I tracked 27 different VIX ETPs and while there were several obvious leaders, the field was still in flux at that time.  In the intervening six years, it has been a war of attrition and that attrition has seen some spectacular departures and renovations, including the “Volmageddon” demise of XIV and the subsequent downward recalibration of leverage in issues such as UVXY and SVXY. 

This time around we have two promising ETFs that will be positioned in two critical spaces in the VIX ETP landscape, as the graphic below shows.  Not only are these products ETFs that avoid some of the potential problems associated with ETNs, including credit/counterparty risk, issuance/creation units risk, and acceleration/closure risk, but they make a valiant effort to address some of the daily rebalancing issues highlighted by the Volmageddon fiasco on February 5, 2018.

Specifically, the feature of these products that I find particularly compelling is the new methodology for daily rebalancing, which essentially uses time-weighted average prices in 5-second intervals covering the last 15 minutes of the standard trading session.  In this manner, the risks associated with liquidity of after-hours rebalancing or dramatic pre-close spikes are all but eliminated.  For more on the details of the end-of-day rebalancing methodology, I recommend Vance Harwood’s Why We Need the LONGVOL & SHORTVOL Indexes.

The two new products are:

UVIX (Volatility Shares 2x Long VIX Futures ETF) – a +2x product that is similar to the TVIX/TVIXF ETN as well as the UVXY ETF prior to its decrease in leverage from +2x to +1.5x on February 28, 2018 (profile, prospectus, more information via Vance Harwood)

SVIX (Volatility Shares -1x Short VIX Futures ETF) – a -1x product that is similar to the old XIV ETN as well as the SVXY ETF prior to its decrease in leverage from -1x to -0.5x on February 28, 2018 (profile, prospectus, more information via Vance Harwood)

With VXX currently in turmoil due to the ongoing suspension of its creation units, both UVIX and SVIX are launching at an opportune time to take market share.  I believe UVIX and SVIX benefit from a superior product design, an improved end-of-day rebalancing methodology, the preferred ETF product wrapper, and attractive leverage/inverse multipliers.  All they need is some liquidity and an active options market before they have the potential to supplant UVXY and VXX as the top products in the VIX ETP space.

In keeping with tradition (the graphic below has been published many times in various incarnations since 2010), I have plotted all of the VIX ETPs with respect to their target maturity (X-axis) and leverage (Y-axis).  [Note that TVIXF and ZIVF, currently traded in very low volumes on the pink sheets, have been omitted from this matrix.]

Now all we need is a product to fill the space left by the departure of ZIV (-1x, with a 5-month average maturity) and I would consider all the important VIX ETP white spaces to be restored.


[source(s):  VIX and More]

Further Reading:
Barclays Suspends Creation Units for VXX
Updating the Current VIX ETP Landscape
VIX ETPs Flash Some Green in 2016
Every Single VIX ETP (Long and Short) Lost Money in 2015
Performance of VIX ETPs During the Recent Debt Ceiling Crisis
Expanded Performance of Volatility-Hedged and Related ETPs
Performance of Volatility-Hedged ETPs
Performance of VIX ETP Hedges in Current Selloff
Slicing and Dicing all 31 Flavors of the VIX ETPs
Charting the Assets of the Volatility-Based ETPs
Four Key Drivers of the Price of TVIX
Will TVIX Go to Zero?
Who Is Trading TVIX?
All About UVXY

For those who may be interested, you can always follow me on Twitter at @VIXandMore

Disclosure(s): net short VXX and UVXY at time of writing


Sunday, October 25, 2020

Updating the Current VIX-Based ETP Landscape

There is a lot going on in the markets, with several themes weighing on volatility or the potential for more volatility.  COVID-19 cases are spiking to new highs in Europe and the U.S. and could be at an inflection point in the U.S.  Election uncertainty is also unnerving investors with the election only nine days away.  Lasts and not least, markets are strongly influenced by the Pelosi-Mnuchin stimulus dance, which appears to have migrated from a tango to a polka – but at least the music is still playing.

In the time since I was a regular contributor in this space, a lot has happened in the volatility world and the VIX ETP space has also changed dramatically.  For this reason, it seems like a good time to update a favored VIX ETP graphic to reflect the many products that have closed, matured and been moved to the pink sheets.  In keeping with tradition (this graphic has been published many times in various incarnations since 2010), I have plotted all of the VIX ETPs with respect to their target maturity (X-axis) and leverage (Y-axis).

It has taken more a decade, but the bottom line is that the VIX ETP space has essentially been narrowed down to two dominant products:

VXX (iPath Series B S&P 500 VIX Short-Term Futures ETN) – the pioneering +1 long volatility ETN that launched back on January 30, 2009 and has been the dominant product in the VIX ETP space throughout its lifetime

UVXY (ProShares Ultra VIX Short-Term Futures ETF) – the +1.5x ETF that spent most of its life as a +2x product and moved to +1.5x following the February 2018 Volmageddon event which resulted in the termination of XIV

Both VXX and UVXY trade an average of over 30 million shares per day and both are regularly in the top 5-10 highest volume ETPs as well as ETP options volume leaders.  The remaining VIX ETPs have been largely relegated to niche product status.  Additionally, Credit Suisse delisted and suspended its VelocityShares ETNs, meaning that the former TVIX, VIIX and ZIV now trade in the OTC market under the symbols TVIXF, VIIXF and ZIVZF.  For this reason and because of low liquidity and the increased risk with trading on the OTC “pink sheets.” I have highlighted these tickers in red.


[source(s):  VIX and More]


Further Reading:
VIX ETPs Flash Some Green in 2016
Every Single VIX ETP (Long and Short) Lost Money in 2015
Performance of VIX ETPs During the Recent Debt Ceiling Crisis
Expanded Performance of Volatility-Hedged and Related ETPs
Performance of Volatility-Hedged ETPs
Performance of VIX ETP Hedges in Current Selloff
Slicing and Dicing all 31 Flavors of the VIX ETPs
Charting the Assets of the Volatility-Based ETPs

For those who may be interested, you can always follow me on Twitter at @VIXandMore

Disclosure(s): net short VXX and UVXY at time of writing


Tuesday, May 2, 2017

Euro Zone VSTOXX ETNs Land on U.S. Beaches!

Think the market is too complacent about this weekend’s election in France?  Worried that the euro area is going to crumble under the weight of Italy’s struggles?  Convinced that Greece, Portugal or Spain are just one more kicked can away from a disaster?

As of tomorrow, investors in the U.S. will have another way to translate these ideas into actionable trades with tomorrow’s launch of two new exchange-traded notes (ETNs) – EVIX (long euro zone volatility) and EXIV (inverse euro zone volatility) – from VelocityShares and UBS that put a European face on existing U.S. VIX-based products such as VIIX and perennial favorite XIV.

Based on the VSTOXX, the VIX-like volatility index for the EURO STOXX 50 Index of 50 blue-chip stocks from 11 euro zone countries, EVIX and EXIV should be familiar to those who are knowledgeable about VXX and VIIX on the long volatility side as well as XIV and SVXY on the short volatility side.  EVIX and EXIV are based on VSTOXX futures and have a target maturity of 30 days – a maturity that is maintained by rolling a portion of the portfolio each day and therefore subjecting both products to the vagaries of contango and backwardation.  In the event these are terms you are not familiar with, I strongly recommend that you click on the links above and educate yourself.  Believe it or not, this is the ninth year I have been talking about the VIX futures term structure, negative roll yield, contango and backwardation.  (Those who have been paying attention since the early days of VXX and VXZ have no doubt profited mightily from this knowledge.)

The beauty of EVIX and EXIV is that these products create so much flexibility for investors who maintain a global, cross-asset class view of volatility.  In the run-up to the first round of the French election, for example, VSTOXX spiked dramatically and pushed the VSTOXX:VIX ratio below 1.00, creating some interesting arbitrage opportunities and/or pairs trades in the process.  Now investors can trade euro zone volatility against U.S. volatility, use targeted hedges for risk that is specific to the euro zone or speculate more easily about the direction of volatility in the euro zone.

I encourage everyone to study the EVIX and EXIV prospectus closely.

This is a huge development in the volatility space and if options on EVIX and EXIV follow later this week, as expected, the volatility trading landscape will be much richer and more diverse. 

Now if we can only get liquid volatility products for gold volatility (GVZ) and crude oil volatility (OVX), I won’t even have to set out a stocking next to the chimney this Christmas.

While I’m at it, why are there no options on XIV?  This is such a popular high-beta product that it deserves options so traders can express a broader range of opinions on volatility.  Readers, it never hurts to nudge the CBOE on these issues.  An outpouring of popular sentiment can make a difference.

As the risk of charging off into full rant mode, I feel compelled to say that I hope volatility investors know a good thing when they see it.  It is a shame that VXST futures did not attract enough attention to hang around and that VMAX and VMIN are not trading with higher volumes.  One of the best volatility products ever created, ZIV, nearly died of neglect before investors finally paid it some attention.

As I see it, EVIX and EXIV as well as VMAX and VMIN are test cases for the future of the breadth of volatility products.  If you would like a diverse tapestry of volatility products in the future, it would not hurt to “buy local” volatility ETPs rather than sticking to the handful of already successful products.  If you don’t vote with your feet, you had better be happy playing in a small and rather limited sandbox.  I am fond of saying, “In volatility, there is opportunity!” – but that opportunity is a function of the richness of the various volatility product platforms.

Last but not least, I know Eurozone and eurozone are the preferred spellings, but I am sticking to the two-word “euro zone” with as much stubbornness as I can muster.  What can I say, I am short convention…

Further Reading:

For those who may be interested, you can always follow me on Twitter at @VIXandMore

Disclosure(s): net short VXX and VMAX; net long XIV and ZIV at time of writing.  The CBOE is an advertiser on VIX and More.

Wednesday, January 4, 2017

VIX ETPs Flash Some Green in 2016

Last year I shocked quite a few investors and media outlets with the publication of Every Single VIX ETP (Long and Short) Lost Money in 2015.  My intent was not to tar and feather the VIX exchange-traded products landscape, but to highlight the fact that in an environment characterized by sharp VIX spikes and other volatility extremes, the power of volatility compounding price decay can overwhelm both long and inverse ETPs. 

In sharp contrast to across-the-board losses in 2015, the performance of VIX ETPs in 2016 was much more balanced and in line with historical norms.  While there were some sharp VIX spikes, the combination moderate volatility, above-average contango and persistent mean reversion translated into a sharp down year for the long VIX ETPs and a strong up year for the inverse VIX ETPs.  The more complex multi-leg, long-short and dynamic VIX strategy ETPs were closest to breaking even for the year, with half of these posting modest gains and half posting small losses.

In the graphic below, I have plotted the performance of all twenty VIX-based ETPs with respect to leverage and maturity, using leverage on the y-axis and maturity on the x-axis.  This group includes five VIX strategy ETPs that have no easily discernible point on the leverage-maturity grid.  Depending on how finely you wish to split hairs, these twenty ETPs account for anywhere from fourteen to eighteen unique ways to trade volatility long and short, across various maturities and according to a wide variety of strategic approaches. 


[source(s): VIX and More]

On the plus side, while both XIV and SVXY were up over 80% during calendar 2016, this performance falls short of the 2012 and 2013 numbers, where each ETP gained more than 100% in both years.  Similarly, while losses of over 93% for UVXY and TVIX must sound like a worst-case scenario for these two products, losses were over 97% in 2012 and just slightly better – at -92% – in 2013.  In terms of consistent winners, while their numbers have been more modest, the most consistent gainers in the VIX ETP space have been ZIV, TRSK and SPXH.

Two new VIX ETPs entered the fray in 2016:  VMIN and VMAX.  While these products have not yet attracted the interest of investors that I believe is warranted (VMAX and VMIN Poised to Be Most Important VIX ETP Launch in Years), there is still time for investors to discover these products.  For the record, VMIN was launched on May 2, 2016 and outperformed both XIV and SVXY from the launch date until the end of the year, racking up an impressive 80.5% return in just eights months of trading.  Going forward, I would expect VMIN to regularly be the top performer in any period in which the inverse ETPs post positive returns.

For those who may be wondering, the VIX index was down 22.9% for the year, while the front month VIX futures product ended the year with a loss of 18.3%.

As is typically the case, contango was a significant performance driver during the course of the year.  Contango affecting the front month and second month VIX futures averaged a relatively robust 8.3% per month during the year (the highest since 2012), while contango between the fourth month and seventh month was slightly above average at 1.8% per month.

During the course of the year, five VIX ETPs were shuttered.  These include VXUP and VXDN, XVIX, CVOL and VQTS.  The biggest factors in the demise of these products was a lack of volume and assets.  In the case of VXUP and VXDN, the product complexity and cumbersome array of distributions also helped to quell investor enthusiasm.  Last but not least, I elected to drop XXV and IVOP from this list as these zombie ETPs both have less than 1% exposure to their underlying volatility index due to the lack of daily rebalancing.  As a result, these have become almost entirely all-cash vehicles, with a dash of volatility.  (For those who are curious about these instruments, follow the links above, click on the link to the prospectus and do a keyword search for “participation.”)

As an aside, for those who may be wondering, the flurry of recent posts is not an anomaly.  There is a lot to be said about the VIX, volatility, ETPs, market sentiment and many of my other areas of interest. With the the-year anniversary of the VIX and More blog just three days away, this seems like a good time to dive head first back into the fray.

Related posts:


For those who may be interested, you can always follow me on Twitter at @VIXandMore


Disclosure(s): net short VXX, VMAX, UVXY and TVIX; net long XIV, SVXY and ZIV at time of writing

Monday, August 24, 2015

Last Two Days Are #5 and #6 One-Day VIX Spikes in History

Many readers have commented that one of their favorite of my regular graphics is the table of VIX spikes of 30% or more that I update periodically in this space, along with the subsequent performance in the S&P 500 Index following these spikes.

This time around I have elected to add an additional column that identifies the catalysts involved (necessarily a subjective process) in each instance. When thinking about these catalysts, it might be helpful to compare the nature of the threat and the size of the VIX spike to changes in volatility during various high-profile historical events, an analysis I captured in Volatility During Crises. Another useful exercise is to think about the fundamental factors influencing each VIX spike in the context of A Conceptual Framework for Volatility Events, which I find particularly useful in helping to gauge just how large of a VIX spike a certain type of event might trigger.

Of course the table below has its own set of data nuggets, both fundamental and technical. One interesting statistic I find worth highlighting is the relatively high frequency of large VIX spikes that have occurred during the past five years. VIX data goes back 26 years and yet more than half of the VIX spikes in this table data are from the past five years. I think it is no coincidence that the VIX ETPs (initially VXX and VXZ) were launched in 2009 and the inverse VIX ETPs (XIV and ZIV) and leveraged VIX ETPs (starting with TVIX) were launched in the following year, when big VIX spikes suddenly became more common – much more so than during the 2008 financial crisis, the dotcom crash, etc. For additional information on the subject of more VIX spikes in spite of a generally lower volatility environment, check out 2014 Had Third Highest Number of 20% VIX Spikes.

History of 30 pct VIX Spikes w Catalysts 082415

[source(s): CBOE, VIX and More]

As noted previously, based on the data for all VIX spikes in excess of 30%, the SPX has a tendency to outperform its long-term average over the course of the 1, 3 and 5-day periods following the VIX spike. Also worth noting that that 10 and 20 days following the VIX spike, the SPX has a tendency not only to underperform, but to decline. Further, while the huge decline following 9/29/08 VIX spike tends to dwarf the other data points, even when you remove the 9/29/08 VIX spike it turns out that the SPX still loses money in the 10 and 20-day period following a VIX spike. When the analysis is extended out 50 trading days, the SPX is back to being profitable, but performing below its long-term average. On the other hand, when the analysis includes 100 days following the VIX spike, the SPX is back to outperforming its long-term average.

In summary, this data suggests that following a 30% one-day VIX spike, there appears to generally be a tradable oversold condition in stocks that lasts approximately one week, followed by a period of another month or so in which the markets typically has difficulty coming to terms with the threat to stocks. This tendency makes today’s market action even more remarkable in that today was by far the worst performance of the SPX in a day following a 30% VIX spike.

Taking a longer-term perspective, looking out at least one quarter, all fears are usually in the rear view mirror and stocks are likely to have tacked on significant gains.

As noted many times here in the past, the data in this table supports the idea of both short-term and longer-term mean reversion, but calls into question the role of mean reversion in the 10-20 days following a VIX spike, where fundamental factors have a tendency to overwhelm a technically oversold condition in stocks.

Related posts:

Disclosure(s): short VIX at time of writing; the CBOE is an advertiser on VIX and More

Monday, January 21, 2013

ZIV Starting to Gain Momentum

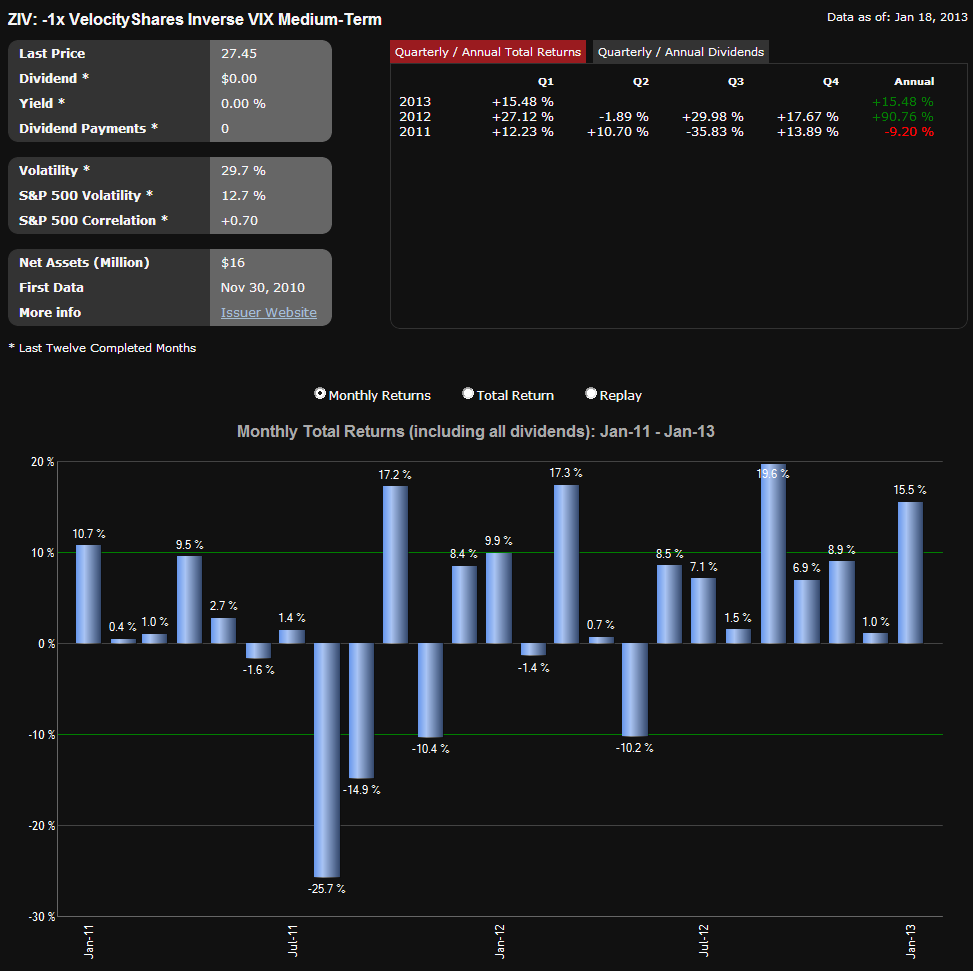
One year ago, I wrote ZIV Undeservedly Neglected when ZIV was trading about 5,000 shares per day and was not even on the radar of many investors who follow the VIX exchange-traded products space. In the land of inverse VIX-based ETPs, it seemed as if XIV was destined to grab all the headlines and the glory, with ZIV relegated to distant also-ran status. Frankly, I was somewhat concerned that ZIV was an ETP with a great deal of potential that might be shuttered due to neglect long before mainstream investors had an opportunity to discover its charms.

One year later, ZIV is still struggling to find adherents, trading approximately 60,000 shares per day as of late, while its performance has become even more difficult to ignore. Over the past year, ZIV is up 103%; and during that period it had a maximum drawdown of only 19%, as the graphic below illustrates. Of course, one can never cut and paste past performance into the future with any degree of certainty, but the record over the course of the past year points toward the potential of ZIV, neglected or otherwise.

[source(s): ETFreplay.com]

A year ago, I summarized some of my thinking on ZIV as follows:

“I am frankly surprised by the lack of interest investors have shown in ZIV, the VelocityShares Daily Inverse VIX Medium-Term ETN. In a nutshell, ZIV has many of the same benefits of long XIV and/or short VXX positions, with much less risk. Specifically, ZIV benefits from negative roll yield about 65% of the time, with VIX futures data going back to 2004 indicating that the annual benefit due to negative roll averages out at more than 20% per year. With XIV getting all the attention, I wonder if investors are aware that XIV is down and ZIV is up since the two products were launched.

Of course, like XIV, ZIV is exposed to sharp spikes in the VIX, as the chart below reflects. It is worth noting, however, that when the VIX spikes, ZIV can be expected to lose value at about half the rate of losses in XIV. For example, while XIV was falling 75%, ZIV was down 42%.  It bears repeating that one of the key features of inverse volatility products is that the potential for large short-term losses is significant, even though the long-term prospects are promising.”

Going forward, ZIV is going to have to make it or break it on its own merits, but for those few who have enjoyed the ride for the past year, it is clear that the potential is enormous – at least under certain market environments.

Related posts:

Disclosure(s): long XIV and ZIV, short VXX at time of writing

Friday, January 4, 2013

VIX ETP Performance in 2012

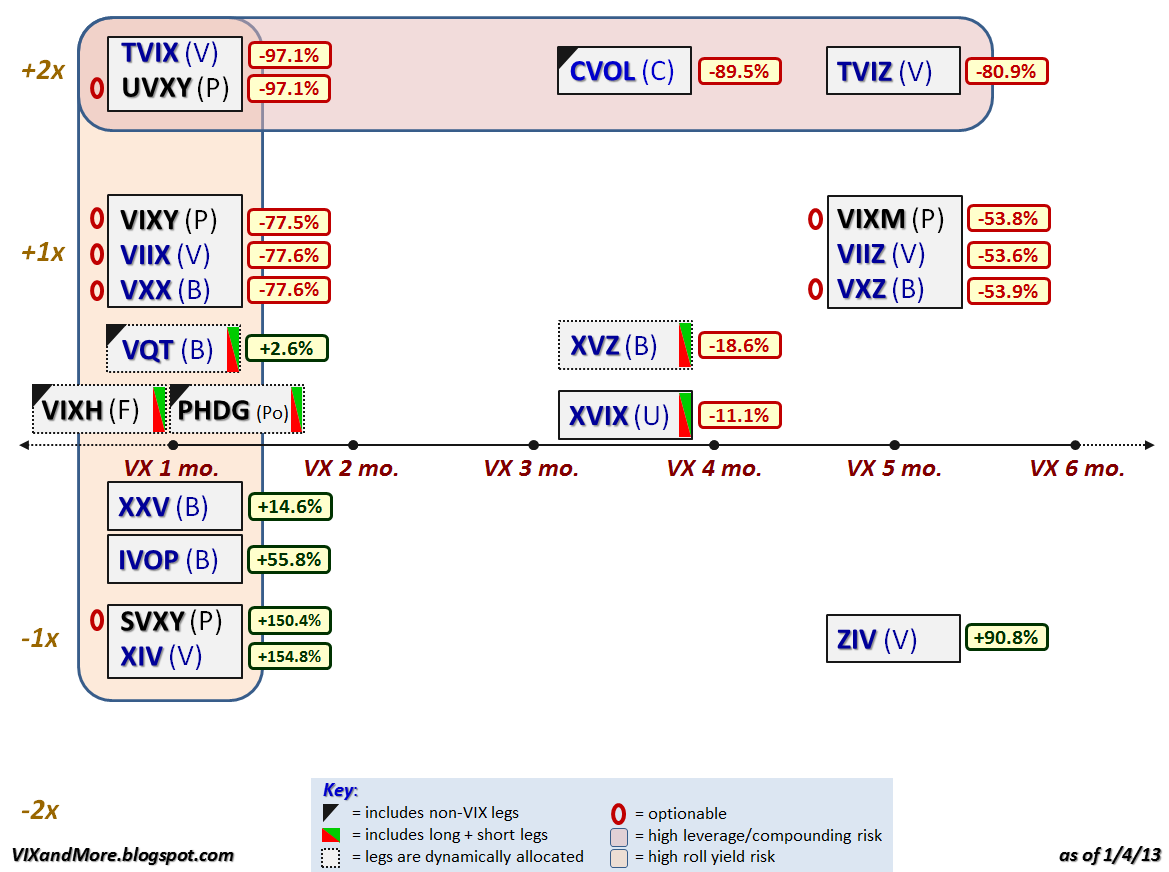
For anyone who pays attention to the VIX exchange-traded products space, 2012 was the year of the inverse (short) VIX futures ETP. The graphic below recaps the performance of the VIX ETPs that were trading as of the end of 2012 and it is easy to see that if you were long the inverse products (XIV, SVXY, ZIV, etc.) and were able to hold on to these positions during volatility storms such as the Greek elections, yield spikes on the sovereign debt of Italy and Spain, the fiscal cliff, etc. (all of which required nerves of steel and a creative risk management approach), then 2012 was a very good year for you. If not, then let the performance ups and downs be a reminder that most of the VIX ETPs are not well-suited for mainstream investors.

Instead of going into too much detail about the performance and reiterating much of what I have already said in the past, I encourage readers to investigate the links below, which include some predictions about future price moves and risk-reward ratios that have been borne out by the events of 2012.

If your new to this product space, perhaps the first place you should begin your research is with posts tagged with labels such as contango, roll yield and term structure – subjects that I have been writing about since the first VIX ETPs were launched, three years ago this month.

[Note that there are no performance numbers for VIXH or PHDG, as these products were launched during the year and have not yet accumulated full-year performance data.]

Related posts:

Disclosure(s): long XIV, SVXY and ZIV at time of writing

Friday, November 30, 2012

XIV and ZIV Are Huge Success Stories Two Years After Launching

It was two years ago today that VelocityShares launched their six VIX-based exchange-traded products and I’m fairly certain I was the only one who was covering that event on the day of the launch: Impressive Launch for Sextet of New Volatility ETNs from VelocityShares.

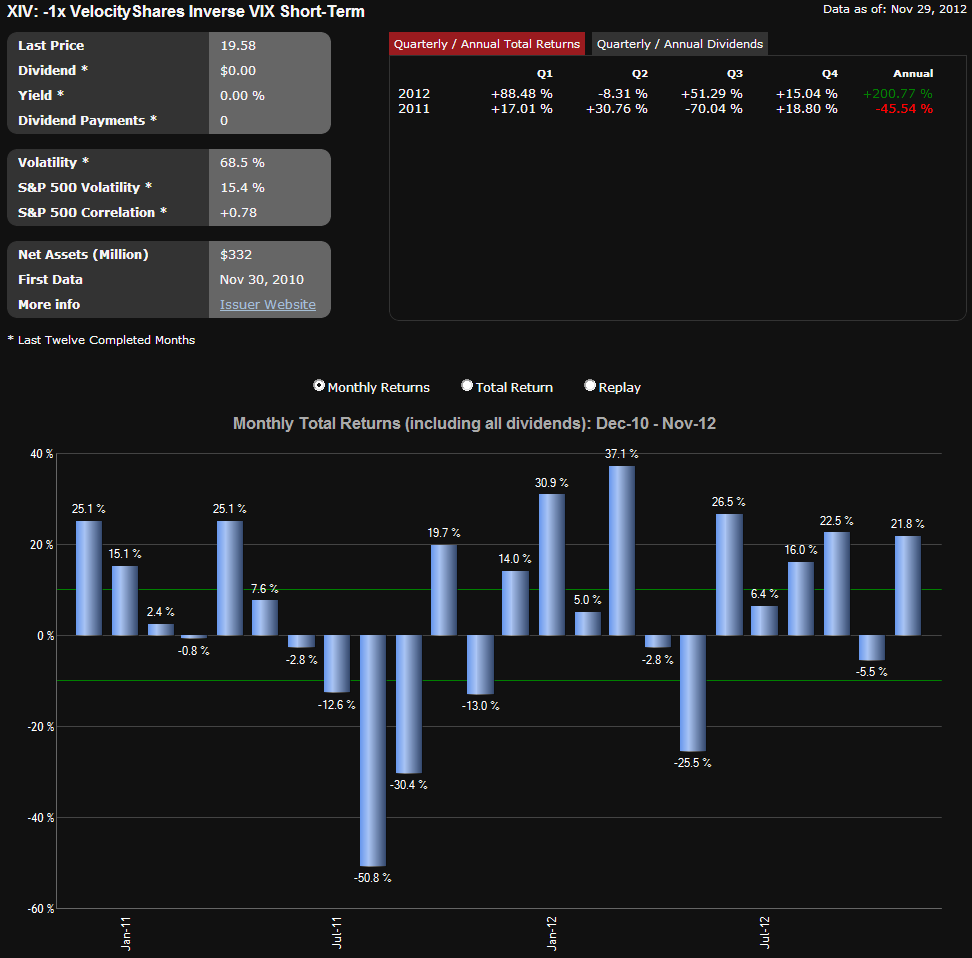
Two years later, one of these products, the VelocityShares Daily Inverse VIX Short-Term ETN, (XIV), is an unqualified success in terms of assets and performance. Over the last three months, XIV has traded an average of more than 12 million shares per day, making it the second most popular VIX-based ETP, after VXX. Part of the reason for XIV’s popularity is no doubt due to performance. As the chart below shows, XIV is up more than 200% for 2012 and has been the top performer across all ETPs for the year.

The amazing thing about the performance of XIV is that it was not very difficult to predict. In fact, less than one week after XIV was launched, I unveiled my bullish forecast for XIV in the Bespoke Investment Group’s second annual roundtable. When asked about some of my favorite picks for 2011 and beyond, I predicted:

“2011 will mark the rise of volatility as an asset class.  Part of the reason for this rise will be the runaway success of VIX-based ETNs and ETFs, notably the recently launched XIV, which will prove that volatility vehicles can be good buy-and-hold investments.”

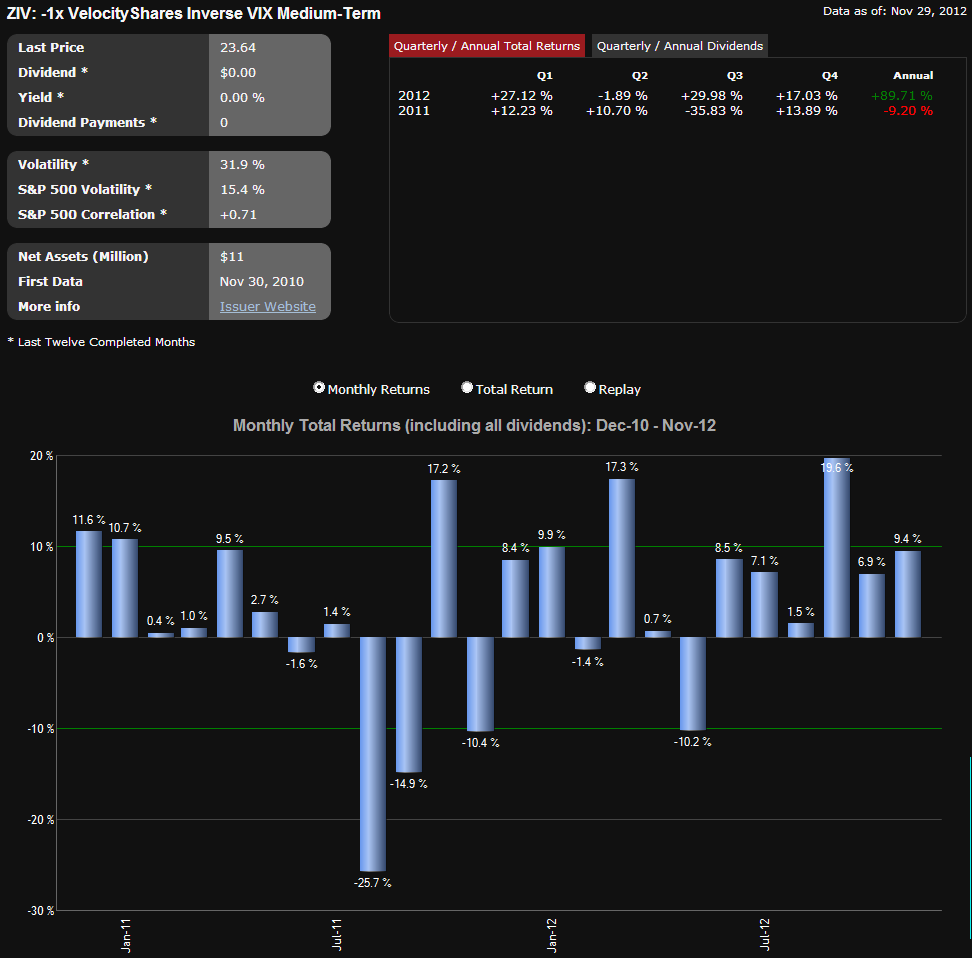
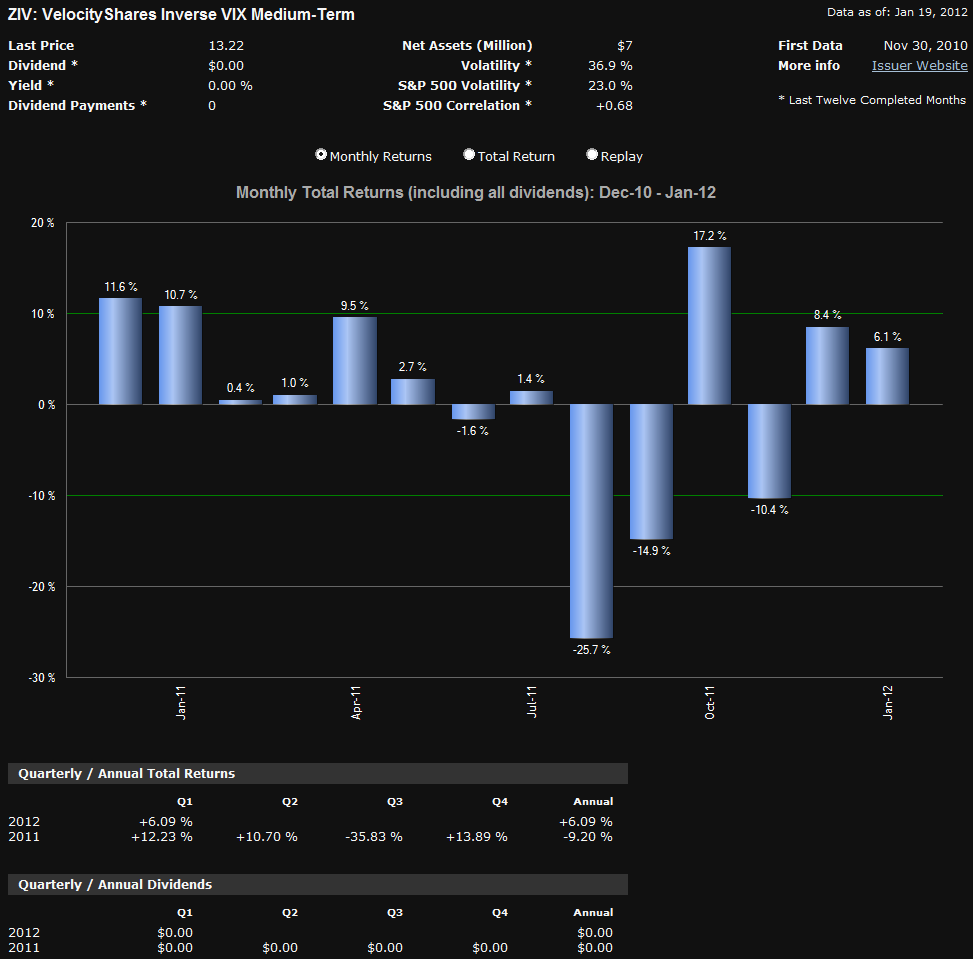
As meteoric as the rise of XIV has been, what surprises me is how little attention XIV’s sibling, ZIV, (VelocityShares Daily Inverse VIX Medium-Term ETN) has received. ZIV typically trades about 10,000 shares per day and yet this ETP has outperformed XIV by a substantial margin since the two were launched. Not only has ZIV been a better performer, but it has done so with considerably less risk. In 2011, for instance, XIV was down 45.54% for the year, while ZIV incurred a loss of only 9.20%. I thought perhaps that my ZIV Undeservedly Neglected post from January of this year might jump-start some interest in ZIV, but for some reason, investors continue to shy away from this impressive performer.

The other four products that VelocityShares launched with XIV and ZIV have had mixed results. The most famous of these is TVIX, which was briefly the top VIX-based ETP in terms of volume in February, before Credit Suisse (CS) suspended creation units in the product, which opened the door to the ProShares Ultra VIX Short-Term Futures ETF (UVXY) displacing TVIX as the top +2x VIX-based ETP. For the most part, VIIX, VIIZ and TVIZ have operated as niche products since their launch.

Going forward, don’t be too surprised if XIV and ZIV continue to post impressive numbers and if you haven’t yet looked at ZIV, it is never too late to do so.

Related posts:

[source(s): ETFreplay.com]

Disclosure(s): long XIV, long ZIV, short VXX and short UVXY at time of writing
Thursday, November 8, 2012

Performance of VIX ETPs During Current Pullback

Of all the issues discussed in this space, undoubtedly the one that captures the imagination of most readers is the subject of VIX-based exchange-traded products. I get more questions about the construction of these products, how they respond to the VIX futures term structure, what factors influence performance, etc.

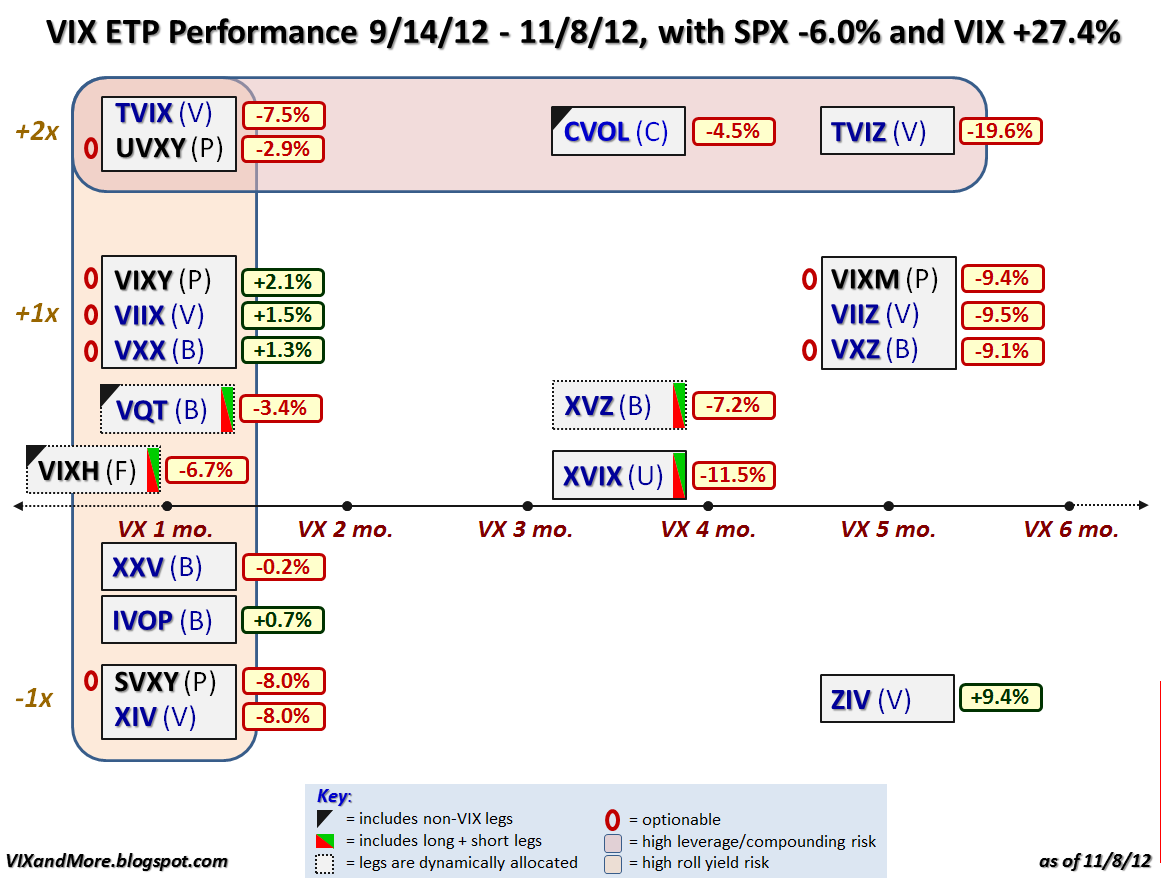
For these reasons I thought it might be instructive to update my VIX ETP landscape chart and include performance data from the September 14th market closing high of SPX 1465 to today’s close of SPX 1377. During that period, the SPX declined 6.0% on a close-to-close basis, while the VIX jumped 27.4% during the same period.

So how did the VIX ETPs fare while the market was selling off?

In examining the graphic below, the first thing you probably notice is that only 5 of the 19 VIX ETPs were able to manage gains during the selloff. In fact the average (mean) VIX ETP performance was a disappointing -4.9%, while the median return was -6.7%. Even more interesting, the inverse volatility products actually outperformed their long volatility counterparts and had the top performer of all, the VelocityShares Daily Inverse VIX Medium-Term ETN (ZIV).

In addition to the static allocation long and short volatility ETPs, there are also three products that use rules-based formulas to dynamically allocate the amount and type of long volatility exposure: VQT, XVZ and VIXH. None of these three products was able to produce a profit during the selloff and the top performer among the group, VQT, managed a loss of 3.4%.

I previously superimposed performance data on this same VIX landscape graphic back on April 3rd in VIX ETP Returns for Q1 2012, following a 12.0% gain in the SPX during that quarter and a 33.8% drop in the VIX. Note that only two VIX ETPs managed to post gains during the bullish first quarter and the selloff of the past eight weeks: ZIV and IVOP. If anyone wonders why I never bother to mention IVOP, first off it has only traded on three days during the past month and second, it has a participation of only 0.13, which means essentially that the portfolio moves as if only 13% of the assets were invested in the underlying index and the balance remained in cash.  As for ZIV, I have been all over this one, including a feature post, ZIV Undeservedly Neglected, back in January.

Now that VIXH has been added to the mix of VIX ETPs, I will endeavor to provide performance updates on some or all of the VIX ETP product space on a more frequent basis going forward.

In the meantime, for those who are in search of reasons why some of the VIX ETPs outperform their peers in various market regimes, the links below are an excellent place to begin your research.

Related posts:

[source(s): Yahoo]

Disclosure(s): long ZIV and XVZ at time of writing

Sunday, October 21, 2012

The 2012 VIX Futures Term Structure as an Outlier

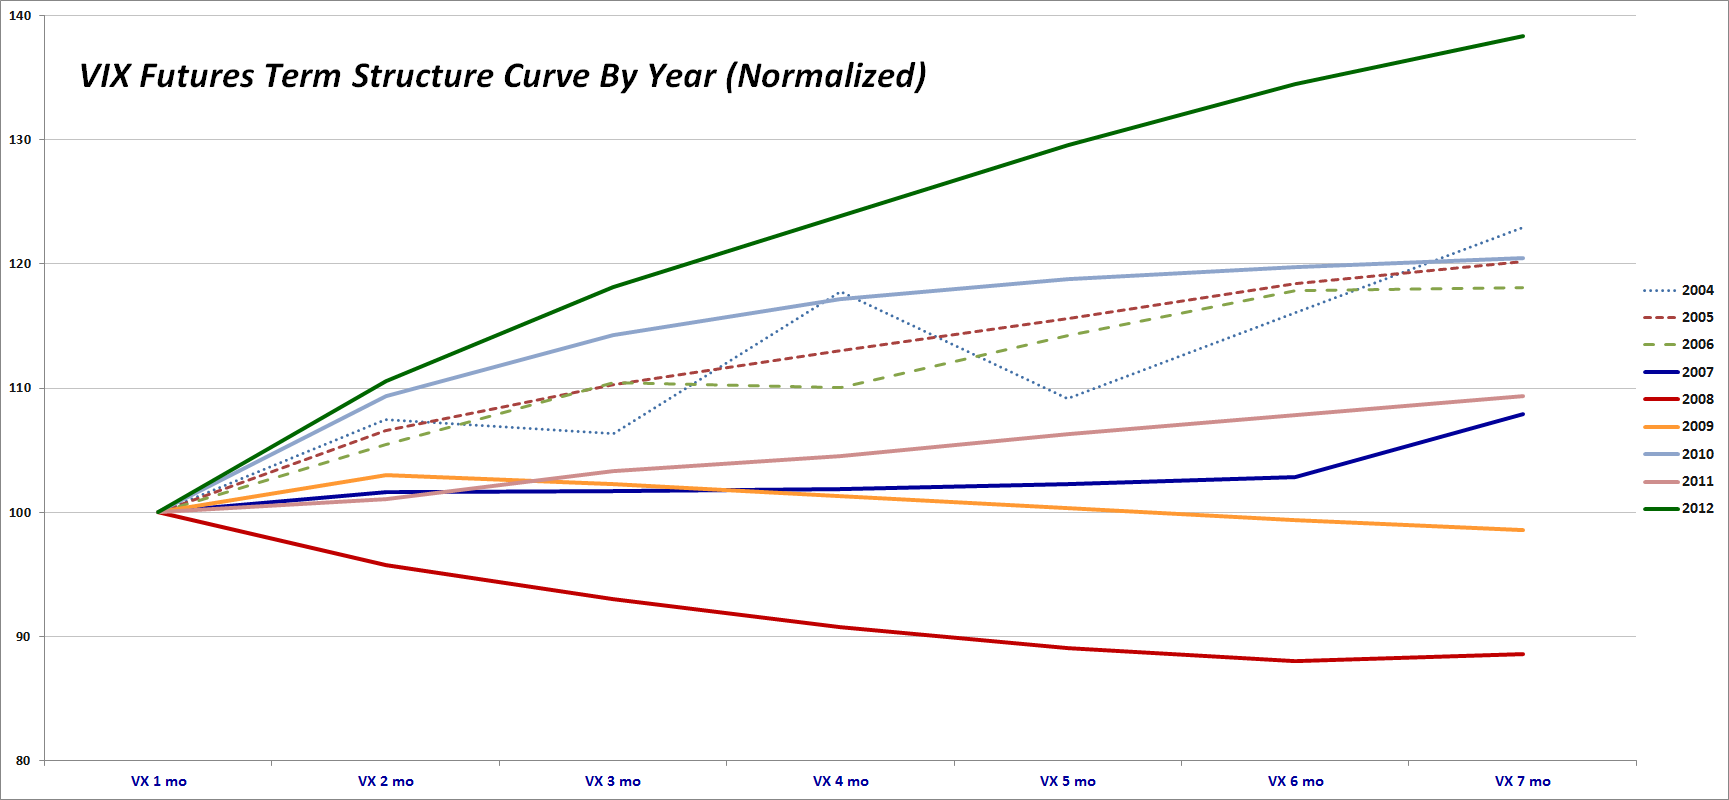
Investors who have been trading the VIX futures, VIX options and VIX exchange-traded products in 2012 have no doubt observed that there has been a wide gulf between the volatility predicted by the VIX front month futures and the back month futures. How wide? Well the graphic below shows the average (mean) normalized term structure for each year since the VIX futures were launched, back in 2004. In normalizing the data, I have set the average front month VIX futures contract to 100 and have expressed the averages of the second through seven months as multiples of the front month.

[Note that while the VIX futures were launched in 2004, consecutive VIX futures contracts for the first six months were not available until October 2006, hence the dotted lines for these years to reflect the erratic nature of the data. Also, I have included the seventh month contract in the calculations because this month is critical to the calculations of a number of VIX ETPs, including VXZ, VIXM, ZIV, etc.]

[source(s): CBOE]

For anyone who has followed the VIX futures closely, it should come as no surprise that 2008 (solid red line) is the only year in which the full VIX futures term structure was in backwardation (front months higher than back months) in aggregate. During 2009 (solid orange line), the term structure transitioned from backwardation to contango (front months higher than back months) and for the most of the balance of its life, the VIX futures term structure has remained in contango.

The graphic shows no discernible trend of extreme contango evolving over the past few years. While 2010 is the year with the second highest degree of contango across the full term structure, contango was decidedly muted during 2011. In fact, 2011 saw the longest continuous stretch of backwardation during the height of the European sovereign debt crisis.

Looking closely at the differences between 2012 and 2010, there is very little difference in contango out to the second month. The normalized term structure curves begin to diverge substantially only after the third month, where the 2010 term structure begins to flatten and the 2012 term structure continues an almost linear ascent. In fact the most distinctive feature of the 2012 term structure is the absence of any significant flattening in the VIX futures curve in months four, five, six and seven. This is part of the reason that while XIV is up 165% for the year, ZIV has managed a gain of 72%.

As this series continues, I will examine some of the possible causes of the recent persistent steep contango in the VIX futures term structure, particularly in some of the back months.

Posts in current series on VIX futures:

Related posts:

Disclosure(s): long XIV and ZIV at time of writing

Tuesday, April 3, 2012

VIX ETP Returns for Q1 2012

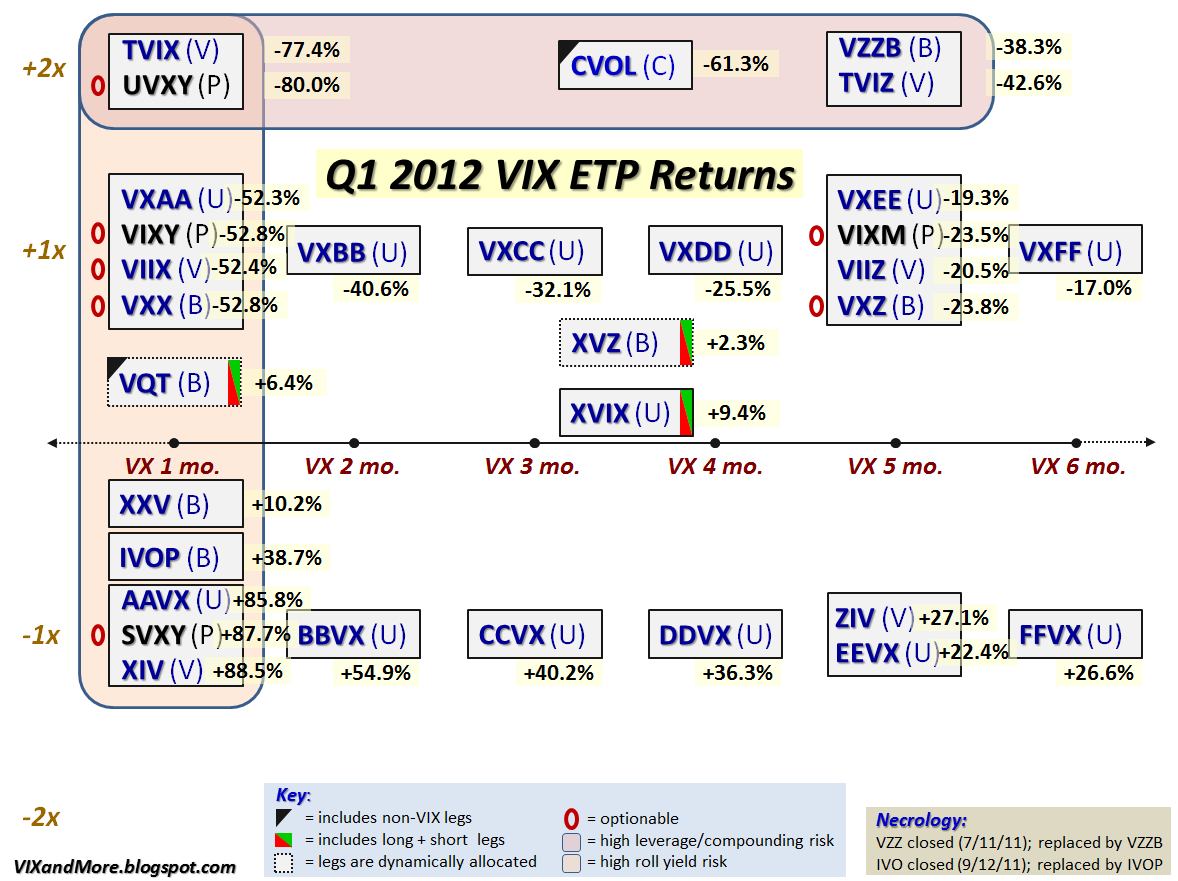
Back in my consulting days, I convinced myself that there were rare instances when an ugly chart crammed full of data should take precedence over a clean and simple graphic that focused on the key takeaways. For my purposes at least, the graphic below, while unlikely to garner accolades from the likes of Information Aesthetics of Flowing Data, is one of those instances and suits my purposes perfectly. [After all, this blog is really just a place for me to archive my own idiosyncratic ideas and the two million interlopers are just a curious side effect, but I digress…]

Getting back to the main point, the graphic below updates the VIX exchange-traded products (ETP) landscape (the only additions are two new red 0s to indicate that UVXY and SVXY are now optionable) and adds performance data for the first quarter of 2012.

Of course anyone who has checked in on this space periodically certainly has already realized that the first quarter saw record contango and negative roll yield across the full spectrum of the VIX futures term structure. As a result of this, the long volatility products had a horrendous three months, the inverse ETPs racked up huge gains and those products with dynamic allocations (VQT and XVZ) or offsetting long and short volatility legs (XVIX) were able to manage small(er) gains.

Following the usual pattern, the products with the shortest target maturities were the most volatile, while those with longer target maturities saw much less movement.

Also notice the symmetry of the return structure. For all the long products that were getting whacked (TVIX, UVXY, VXX, TVIZ, etc.) there were corresponding inverse products (XIV, SVXY, ZIV, etc.) that were racking up larger gains than the losses suffered by their long volatility counterparts.

Last but not least, perhaps the distribution of the returns will help to explain why I have organized my previous VIX ETP ‘field guides’ in this fashion.

This graphic should implicitly raise a bunch of issues and the links below are good jumping off points for further exploration regarding a number of those issues.

For the time being I will leave additional analysis to those in the comments section.

Related posts:

Disclosure(s): long XIV, ZIV, BBVX and XVZ; short TVIX, UXY and VXX at time of writing

Tuesday, March 27, 2012

VXX, VXZ, XIV and ZIV During Eleven Months of a Sideways VIX

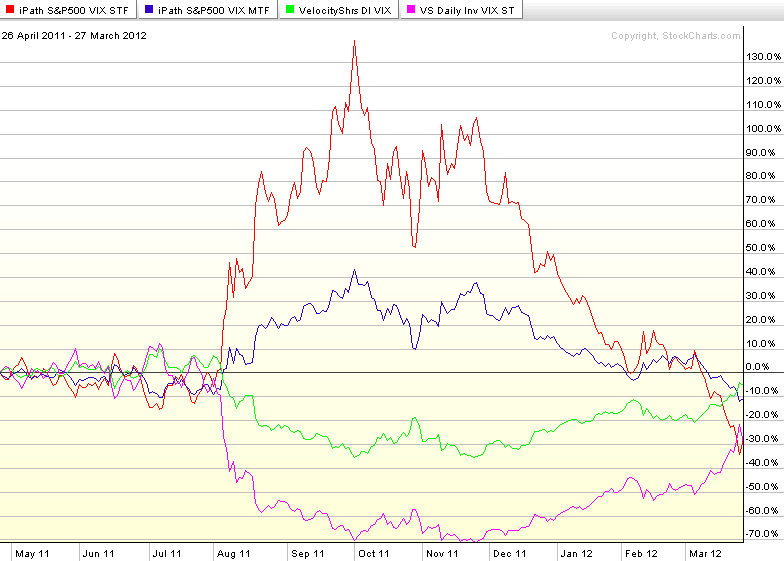
The VIX closed at 15.59 today, just 0.03 points lower than the close of 15.62 on April 26, 2011, some eleven months ago.

From a long-term perspective, not much has happened with the VIX, but for those who have ridden the volatility roller coaster up and down, the present time seems like an excellent opportunity to reflect on where the ride has taken us.

For those who have traded VIX exchange-traded products (ETP) during the last eleven months, the ride has been much different than that of the VIX itself, an issue I highlighted in VIX Exchange-Traded Products: The Year in Review, 2011, when I concluded, “While it is interesting that both the long and short volatility ETPs were unable to turn a profit for the year, there were stretches during 2011 that various VIX ETPs produced extraordinary gains.”

In the graphic below I have highlighted the performance of four popular VIX ETPs that are the most actively traded issues among the several that occupy a competitive space with a similar leverage factor and weighted average maturity (see Slicing and Dicing All 31 Flavors of the VIX ETPs for additional details):

  • VXX – iPath S&P 500 VIX Short-Term Futures ETN (red line)
  • VXZ – iPath S&P 500 VIX Mid-Term Futures ETN (blue line)
  • ZIV – VelocityShares Daily Inverse VIX Medium-Term ETN (green line)
  • XIV – VelocityShares Daily Inverse VIX Short-Term ETN (violet line)

Note that while the VIX traded sideways, all four VIX ETPs lost money, with the worst losses being incurred by VXX, which was down 28% during this period.

Not surprisingly, the two ETPs with the five-month target maturity (VXZ and ZIV) were considerably less volatile than their one-month target maturity counterparts.

There are a number of potential takeaways here, but perhaps the biggest of these is that VIX ETPs will struggle to outperform the VIX over longer-term time horizons. For these trades to be profitable, proper market timing is of the essence, as is the ability to take profits and/or cut losses when the trade starts to move sharply in the wrong direction.

Related posts:

[source(s): StockCharts.com]

Disclosure(s): long XIV and ZIV, short VXX and VXZ at time of writing

Thursday, February 16, 2012

Monitoring VIX Futures and Their Impact on VIX ETPs

This morning was one of those mornings where stocks were up, the VIX was up and some of the VIX futures were up even more than the cash VIX – at least before the latest round of news from Greece hit.

It is on days like these when my inbox invariably receives several questions from traders who are relatively new to VIX exchange-traded products (ETPs) such as XIV or ZIV and cannot understand why these are not moving with the SPX or in the opposite direction of the VIX. The answer, of course, is that these products do not track the SPX or even the cash VIX, but the VIX futures.

The reason many traders have so much difficulty with the VIX futures component of VIX ETPs is that their brokerage account is authorized for stocks and ETPs and in some cases options, but not futures. Further, most stock brokers do not have futures available to trade and a large portion of those who do allow futures trades do not have VIX futures on the menu (largely due to the regulatory split between the SEC and the CFTC, but I digress…)

So what is a VIX ETP investor to do?

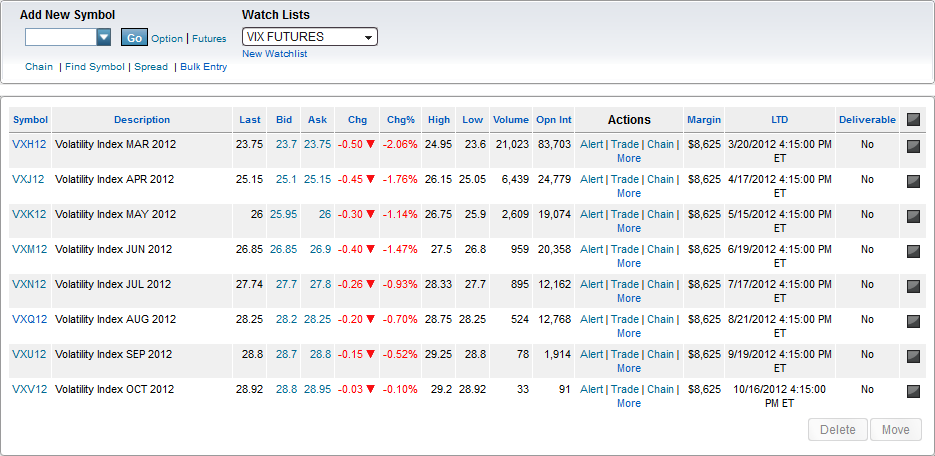
Well, VIX futures quotes are always available at the CBOE Futures Exchange (CFE) on their main splash page. Unfortunately, these quotes are delayed 15 minutes.

There are, however, two popular options brokers who also have VIX futures quotes. The first of these, Interactive Brokers (IBKR), is known for their wide range of products available to trade, technology and low transaction costs. They are not known for hand-holding and high levels of customer service. If you already have an account there and know your way around or you are used to figuring out most things for yourself and are partial to a self-service model, this is probably your best bet for VIX futures quotes.

For those who are new to VIX futures and prefer to have a strong customer service safety net, a better choice is probably optionsXpress, which was acquired by Charles Schwab back in March 2011. Optionsxpress has an excellent tool set for the options trader and also has a fair amount of functionality for futures traders. Whereas Interactive Brokers excels at a low-cost self-service model, optionsXpress has more of a high touch model and charges more for the additional service component. In short, optionsXpress is likely to be a better choice for those who are new to futures and VIX ETPs.

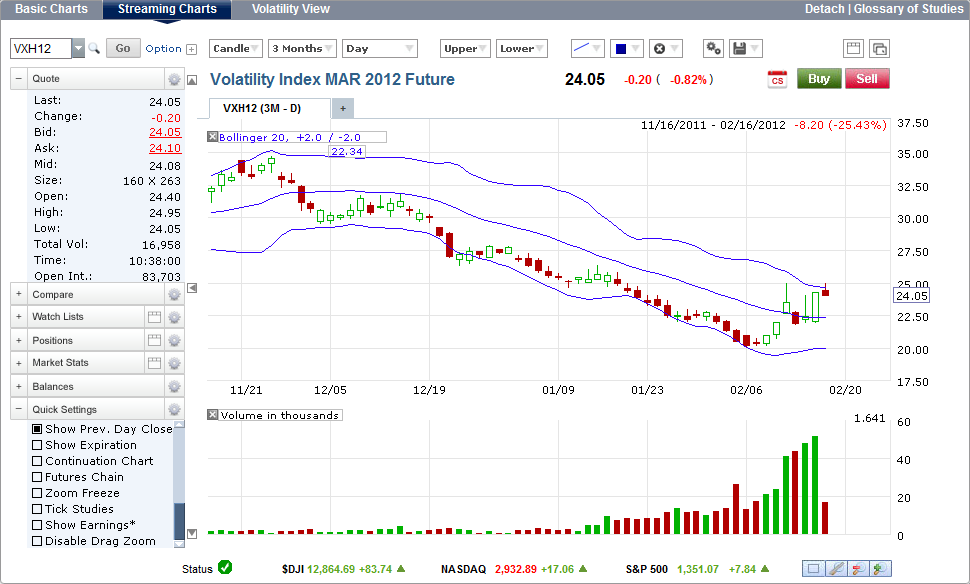
Below I have captured a (customizable) VIX futures watch list that I created in optionsXpress and have sorted by last trade date (LTD), as well as a snapshot of one of their streaming charts for the VIX March 2012 futures contract, VXH12. Note the fairly substantial amount of data, as well as a highly customizable chart.

There are other brokers out there, but my hunch is that those who are new to VIX ETPs are more likely to have an existing account with optionsXpress than any of the other stock/options brokers that also let you trade VIX futures. If not, optionsXpress is still a good place to get started in futures and specifically in VIX futures trading.

Related posts:

[source(s): optionsXpress.com]

Disclosure(s): long XIV and ZIV at time of writing

Thursday, February 2, 2012

Slaying the Natural Gas Contango Dragon

Yesterday’s post on Natural Gas, Contango and UNG appears to have generated a fair amount of interest across a broad base of readers, so for an encore I have decided to forego the typical collection of dazzling Liszt miniatures and skip directly to more on the ways to benefit from the persistent contango and negative roll yield in natural gas.

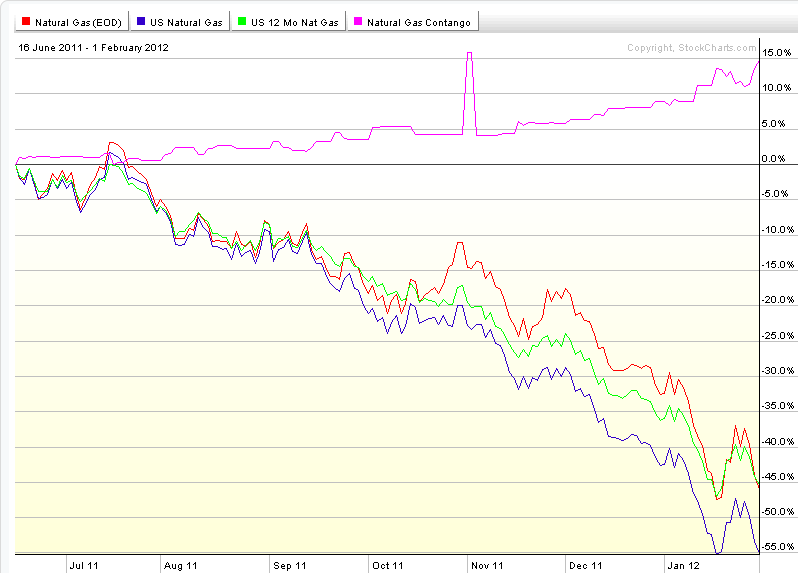
Starting with the graphic below, I have plotted the performance of natural gas (red line) and three natural gas ETPs since June 16, 2011:

  • United States Natural Gas Fund (UNG) – blue line
  • United States 12 Month Natural Gas Fund (UNL) – green line
  • UBS ETRACS Natural Gas Futures Contango ETN (GASZ) – pink(ish) line

The reason the graph begins in June 2011 is that it marks the launch of GASZ; the other two ETPs have a much longer track record.

First, note that UNG does not attempt to minimize its exposure to contango. Like many other futures-based ETPs, its objective is to hold a one-month weighted average constant maturity in its portfolio and it does this by buying second month futures and selling front month futures. UNL, launched after UNG, was an attempt by the same issuer to minimize contango by holding twelve months of natural gas futures contracts on the assumption that contango is likely to be steepest at the front end of the futures curve and flatter in the more distant months. As the chart below shows, the recent performance differential between UNG and UNL has been minimal.

The UBS ETRACS product, GASZ, takes a completely different approach and is based on a natural gas futures spread index that shorts the front month and is long some of the more distant months. In other words, this ETP is specifically designed to take advantage of contango. According to UBS:

“The ISE Natural Gas Futures Spread™ Index, through a series of investments in natural gas sub-indices, effectively provides short exposure in front month natural gas futures contracts and long exposure in mid-term natural gas futures contracts. This is achieved by taking a 100% long position in the components of the ISE Short Front Month Natural Gas Futures™ Index, which provides short (or inverse) exposure to the ISE Long Front Month Natural Gas Futures™ Index and an aggregate 100% long position in the components of the ISE Twelfth Month Natural Gas Futures™ Index, ISE Thirteenth Month Natural Gas Futures™ Index and ISE Fourteenth Natural Gas Futures™ Index (33.33% per index), which provides long exposure to the mid-term Henry Hub Natural Gas Futures (NG) futures contracts. The index is rebalanced monthly before the Sub-Indices’ roll process to maintain the 1:1 ratio.”

For more information, check out the GASZ web site and prospectus.

The results, at least as seen in the chart below, show that the GASZ approach has some promise insofar as the last eight months are concerned. To be fair, GASZ is very thinly traded and has yet to inspire a broad group of investors, but here is an approach that is not likely to be correlated with any strategies investors are currently running and has been racking up profits in a sideways (at least for equities) market.

Of course investors can always short UNG, but I believe that in much the same manner that ZIV is undeservedly neglected as an inverse VIX futures contango play, so is GASZ overlooked for the same reasons. These are two ETPs with a lot of potential that deserve a broader audience.

Finally, as a side note, UNG announced late yesterday that it will undergo a reverse 1-4 split following the market close on February 21. Here is a product that is down more than 40% in each of the last three years and is already down more than 21% in 2012. Don’t be surprised if this is not the last reverse split.

Related posts:

[source(s): StockCharts.com]

Disclosure(s): long GASZ and ZIV, short UNG at time of writing

Friday, January 20, 2012

ZIV Undeservedly Neglected

Much to my amazement, next week will mark the third anniversary of the launch of the first two VIX ETPs: the S&P 500 VIX Short-Term Futures ETN (VXX) and the S&P 500 VIX Mid-Term Futures ETN (VXZ).

Some may recall that investors were slow to warm up to these ETNs (see Charting the Assets of Volatility-Based ETPs), but these two products are now #1 and #5 in the very successful volatility ETP space, with assets of $700 million and $188 million, respectively.

It is no secret that VXX has always been the darling of short-term traders, while VXZ has struggled at times to find a broad audience. As investors have become better educated about the influence of the VIX futures term structure and resulting roll yield on returns, interest in VXZ relative to VXX has picked up, but the latter, with its target maturity of five months, continues to play second fiddle to its short-term (one month target maturity) sibling.

I was curious see how this dynamic played out when VelocityShares rolled out two products that are essentially the inverse of VXX and VXZ in November 2010. Once again the short-term product captured the bulk of the interest of traders, as XIV quickly established itself as the #2 product in the VIX ETP space. While the love for XIV is certainly understandable, due to the history of persistent contango and negative roll yield in VIX futures, this product suffered a huge drawdown as the European sovereign debt crisis and resulting record backwardation wiped out 75% of the ETPs value from July through November 2011.

Against this backdrop, I am frankly surprised by the lack of interest investors have shown in ZIV, the VelocityShares Daily Inverse VIX Medium-Term ETN. In a nutshell, ZIV has many of the same benefits of long XIV and/or short VXX positions, with much less risk. Specifically, ZIV benefits from negative roll yield about 65% of the time, with VIX futures data going back to 2004 indicating that the annual benefit due to negative roll averages out at more than 20% per year. With XIV getting all the attention, I wonder if investors are aware that XIV is down and ZIV is up since the two products were launched.

Of course, like XIV, ZIV is exposed to sharp spikes in the VIX, as the chart below reflects. It is worth noting, however, that when the VIX spikes, ZIV can be expected to lose value at about half the rate of losses in XIV. For example, while XIV was falling 75%, ZIV was down 42%.  It bears repeating that one of the key features of inverse volatility products is that the potential for large short-term losses is significant, even though the long-term prospects are promising.

Finally, for those who are investing in or trading VIX-based ETPs, it is important to keep in mind that short-term returns are most likely to be a function of changes in the VIX and VIX futures, while long-run returns will be dominated by the VIX futures term structure.

Related posts:

[source(s): ETFreplay.com]

Disclosure(s): long XIV and ZIV, short VXX at time of writing

DISCLAIMER: "VIX®" is a trademark of Chicago Board Options Exchange, Incorporated. Chicago Board Options Exchange, Incorporated is not affiliated with this website or this website's owner's or operators. CBOE assumes no responsibility for the accuracy or completeness or any other aspect of any content posted on this website by its operator or any third party. All content on this site is provided for informational and entertainment purposes only and is not intended as advice to buy or sell any securities. Stocks are difficult to trade; options are even harder. When it comes to VIX derivatives, don't fall into the trap of thinking that just because you can ride a horse, you can ride an alligator. Please do your own homework and accept full responsibility for any investment decisions you make. No content on this site can be used for commercial purposes without the prior written permission of the author. Copyright © 2007-2023 Bill Luby. All rights reserved.
 
Web Analytics