VXX:VXZ Ratio
Since its launch on January 30th, the iPath S&P 500 VIX Short-Term Futures ETN (VXX) has generated an enthusiastic following, with an average volume of 400,000 shares traded each day. The same claim cannot be made of VXX’s more problematic sibling, the iPath S&P 500 VIX Mid-Term Futures ETN (VXZ), where 100,000 share days are more the exception than the rule.
In spite of the lack of popularity, VXZ, which attempts to replicate the changes in VIX futures approximately five months out, should not be overlooked. In fact, comparisons between the movements of VXZ and VXX provide some interesting insights into the ebb and flow of volatility expectations.
Take the VXX:VXZ ratio, for instance. In some respects this indicator is similar to the VIX:VXV ratio I introduced back in 2007. There are some important differences between the two ratios, however, which are worth noting. First and foremost, you can trade both VXX and VXZ; neither VIX nor VXV can be traded directly. Second, and related, both VXX and VXZ are exchange-traded notes (ETNs), while VIX and VXV are indices. Finally, whereas VXX and VXZ look out one month and five months, the VIX and VXV indices look out one month and three months.
For those seeking to compare near-term volatility expectations with volatility expectations several months out, both the VIX:VXV ratio and the VXX:VXZ ratio are excellent tools. From a data perspective, the index ratio has 19 months of real-time historical data. Unfortunately, the VXX:VXZ ratio has only 4 ½ months of real-time (i.e., non-reconstructed) data to draw from. On the other hand, data for the VXV index is sometimes difficult to come by, while VXX and VXZ data are widely distributed.
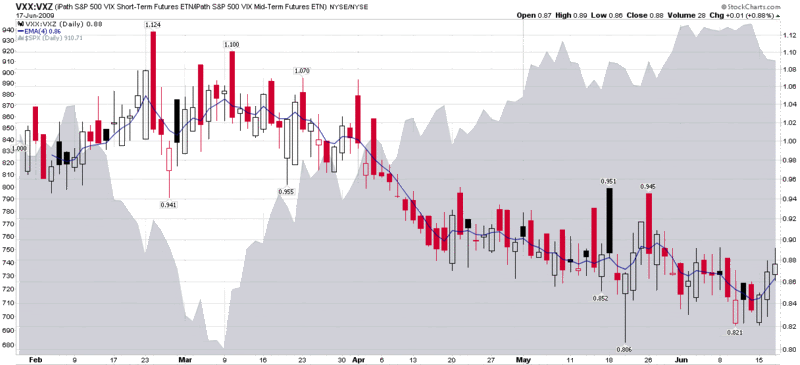
The chart below shows the full history of the VXX:VXZ ratio, using a 4-day EMA (blue line) as a smoothing factor. While this indicator is still quite youthful, I find it encouraging that the recent bottom in the ratio coincided with a topping pattern in the SPX. Further, the double top in the ratio that completed on March 9th also coincides with the bottom in the SPX.
Going forward, I will compare the VXX:VXZ ratio to the VIX:VXV ratio and subject both ratios to some additional scrutiny.


5 comments:
Very nice Bill, I'll be watching also. It does appear to track close to the $vix:$vxv ratio.
Here is a chart I created to watch both ratio's at once.
http://stockcharts.com/h-sc/ui?s=$VIX:$VXV&p=D&yr=0&mn=6&dy=0&id=p23565380443&listNum=1&a=170448679
Bill,
Although there is very little data to pull from, but what levels in the VXX:VXZ ratio would you consider to be "buy" or "sell" signals
Thanks for the chart, Greg. Nice work.
Regarding specific levels as market timing signals, I am less interested in absolute levels of the ratio and am more interested in major reversals (tops/bottoms) in the 4 day EMA (or some similar smoothing factor.)
Cheers,
-Bill
Here's the IUG chart for your consideration: http://tinyurl.com/m2mkau
IUG (Implied SPX Variance) spiked up over the past few days - signals a paradigm shift coming in the days ahead. RUG down less than VIX
ghh
Bill, your ratio (0.914)just made this bear's day!!
Keep the good work going!
Post a Comment