ETFs, Leverage and Strangles
I was surprised by the volume of the feedback I received from last week’s Using Options to Control Risk in Leveraged ETFs. Clearly there is a great deal of interest in options and leveraged ETFs.
Among the emails I received were several questions about strategies associated with ETFs. For the record, my intent here is not to advocate a particular strategy, but merely to illuminate various strategic building blocks that I believe should be part of the trading arsenal of any options trader.
With that out of the way, let me spend a minute talking about strangles. I realize I have not talked about strangles as much as straddles here, but I actually prefer to trade strangles instead of straddles when I am selling options. Whereas, the point of maximum profit for a straddle is a point that often resembles a Sisyphean lottery, strangles have a maximum profit zone that is much wider and easier to manage.
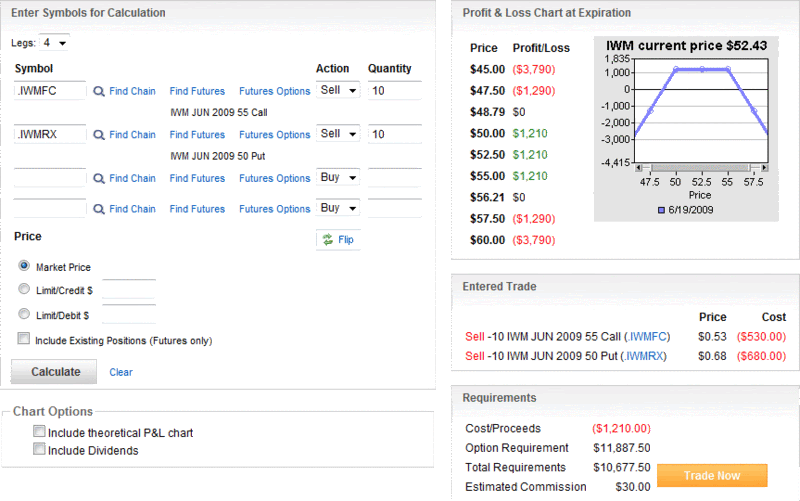
In the chart immediately below, I have taken a snapshot of a short strangle on IWM, which is an ETF for the Russell 2000 small cap index. The short strangle is created by selling 10 June 50 puts and selling 10 June 55 calls. In this example, the puts have an implied volatility of 37 and the calls have an implied volatility of 31. Note that the maximum profit on this short strangle is $1210 and occurs if IWM closes anywhere from 50 to 55 at expiration. The full profit zone spans 7.92 points from 48.79 to 56.71.
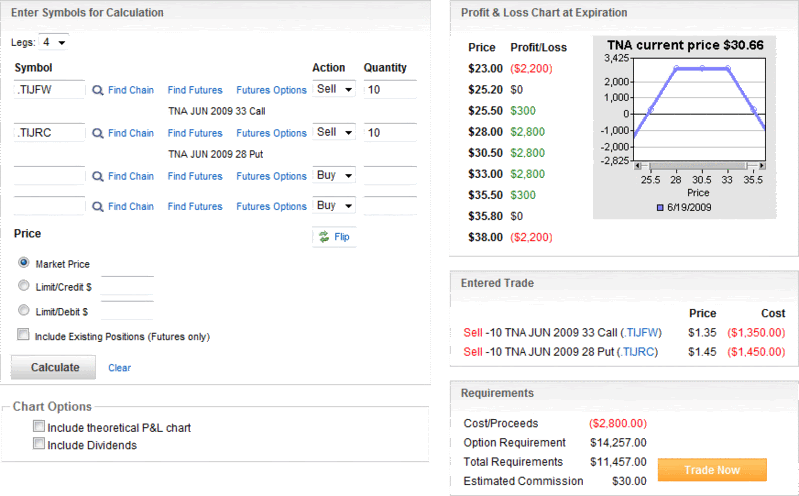
TNA is a 3x ETF for the same Russell 2000 small cap index. Whereas IWM closed at 52.43, TNA closed at 30.66, a little more than 41% below its 1x sibling. Even at a significantly lower price, however, the firepower of the 3x ETF is immediately obvious when you look at the options. The chart below shows the result that is created by selling 10 June 28 puts and selling 10 June 33 calls. As in the IWM example, the strikes have a five point interval. The differences in the profit and loss graphic below are largely a result of the extreme differences in volatility. In this example, the puts have an implied volatility of 92 and the calls have an implied volatility of 87 – almost, but not quite, three times that of IWM. As result of the higher volatility, the maximum profit is $2800 (between 28 and 33), while the full profit zone is 10.60 points, from 25.20 to 35.80.
In brief, for an implied volatility that is about 2.6 times higher, TNA offers a maximum profit that is 2.3 times greater and profit zone that is 1.3 times larger.
These comparisons are admittedly less than perfect, given that the IWM and TNA trade at much different prices, but they certainly convey the essence of the idea that in a range-bound market, an options seller who is short options on 3x leveraged ETFs can rack up large gains (or losses) in a hurry. Of course, this same trade can be made much less risky by "buying the wings" and turning the strangle into an iron condor.
For a related post, check out The Options Opportunity Matrix.
[graphics: optionsXpress]


6 comments:
Thanks. The thinkorswim software, free with delayed data, is great for modeling positions, including the ability to see what an increase or decrease in volatility will do to a position (click on the little wrench icon).
I have found strangles to be very good spread. you must pick the right strikes with similar deltas but if you expect a move you can really make out well. trade into them trade out of them each leg. they worked great during the crazy swings in oct nov
yeezy
supreme clothing
curry 7 shoes
kobe sneakers
golden goose sneakers
supreme new york
lebron 17 shoes
golden goose sneakers
bape hoodie
kd shoes
replica bags hermes replica bags turkey zeal replica bags reviews
Our site dolabuy ysl reference original site Continue Reading index
x2z64r7y26 o5q25o3f19 b4e65o1v97 f7s12n5w24 k9h49u3l03 v8y78y8o16
Post a Comment