Volatility in Context with VIX at Post-Lehman Low
Yesterday the VIX closed at 28.27, its lowest close since the VIX ended the day at the 25.66 level on September 12, 2008 – the Friday before the Lehman Brothers bankruptcy filing.
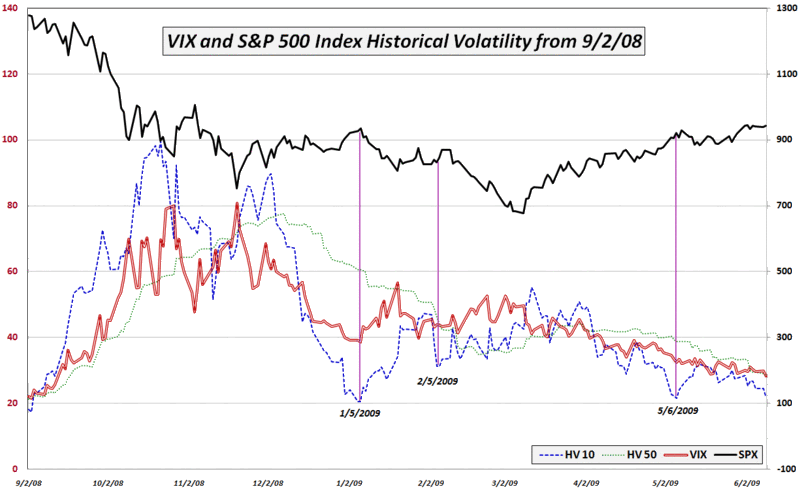
In addition to the new lows in the VIX, a number of measures of historical volatility (HV) in the S&P 500 index are also at levels not seen since the week of the Lehman Brothers bankruptcy. These include 20 day HV (24.65), 30 day HV (25.50) and 50 day HV (28.57). Further, while the 10 day HV has not yet fallen below recent May and January lows, at 21.54, this is the type of number that makes the 30+ VIX advocates more than a little nervous.
The culprit is recent range-bound trading in which yesterday’s 3.29 point gain in the SPX is actually the largest daily change in the past three trading days. For the last six sessions, the SPX has hardly moved at all, which has driven historical volatility – also known as realized volatility – dramatically lower.
The chart below shows the trends in the VIX and historical volatility in the SPX since last September. Note that since the March lows the VIX has been falling in conjunction with the highlighted 10 day and 50 day historical volatility measures. Note also that the last three times 10 day HV got significantly ahead of the VIX (1/5, 2/5 and 5/6) each time this was a precursor to topping action in the SPX. As the 10 day historical volatility in the SPX gets ahead of the VIX once again, it is reasonable to ask whether this pattern will continue and we will see another topping pattern in the next few days.

[graphic: VIXandMore]


3 comments:
Nice post!
Vix June futures are .80 premium to VIX. July futures are 2.74 premium. I understand that it takes several weeks of this spread holding its premium before market cracks
This is history in the making. You can see the fall coming.
Post a Comment