Showing posts with label IWM. Show all posts

Saturday, July 11, 2015

Seizing Opportunity From Stock Market Volatility (Guest Columnist at Barron’s)

Steve Sears and I have a running joke that whenever I am tapped as a guest columnist for The Striking Price at Barron’s, we should both start buying VIX calls as inevitably something is going to come along and cause a volatility spike just in time to give me something topical to discuss.

This time around I thought China might be the culprit or Greece or Puerto Rico or the Fed or maybe even the NYSE. In fact, it was a cocktail of everything that has turned a relatively quiet Q2 into a much more menacing volatility environment in Q3. In Seizing Opportunity From Stock Market Volatility, which appears today in Barron’s, I turn my attention to small caps (RUT, IWM) and use IWM vs. SPY as a way to think about relative volatility in the context of exposure to China, the euro zone and a strong dollar. Focusing on the Russell 2000 Volatility Index (RVX) and VIX, investors have been attributing roughly the same level of uncertainty and relative risk for small caps as large caps, which I see as questionable when one considers the very different exposure each asset class has to global issues and the dollar.

Given that RVX futures (VU) are thinly traded, it probably does not make sense to be short VU and long VX, the VIX futures. Another way to translate the thinking above into a strict volatility trade would be to short an at-the-money straddle for RUT or IWM, while going long an at-the-money straddle for SPX or SPY. That type of trade is probably a stretch for most Barron’s readers, but I suspect is probably right in the wheelhouse of many readers in this space. For the Barron’s article, I came up with something simpler to execute, an IWM Aug 121/123 bull put spread, which has both volatility and directional components to it and is disengaged from volatility in SPX/SPY.

In the Barron’s article, I talk a little bit about selling volatility in a post-crisis market environment or following a significant volatility event, observing:

“Selling options on the downslope of a volatility spike is often only marginally less profitable than selling options at the top of a volatility spike.”

If any of this sounds a little bit like a corollary to some of my work on “disaster imprinting” then some readers clearly have very good memories.

Related posts:

A full list of my (16) Barron’s contributions:

Disclosure(s): none

Tuesday, April 15, 2014

The Correction As Seen in the ETP Landscape

Since stocks bottomed in March 2009, I have periodically been publishing an SPX pullback table and occasionally a plot of all those pullbacks and their duration. The recent selloff in stocks, however, has been anything but an SPX pullback. I toyed with the idea of presenting comparable data for the NASDAQ Composite or NASDAQ-100 Index (NDX), but here again, the selling has been disproportionate in some areas of the NASDAQ universe, even though it has been hit harder than the SPX.

This time around I have opted instead for a chart that shows the peak-to-trough drawdown across the equity ETP universe, focusing on sector groups that I believe are among the most important to watch.

ETP Landscape 2014 DDs 041514

[source(s): Yahoo, VIX and More]

The data above cover only 2014 and indicate the maximum drawdown since the 2014 peak. While many of these maximum drawdowns are from earlier today, there are quite a few instances in which the maximum drawdown was established earlier in the year.

Note that while the NASDAQ gets most of the attention, it is the small caps (IWM) that have suffered the most among the major market index ETPs.

Not surprisingly, biotechnology (IBB), social media (SOCL) and Russia (RSX) have seen the largest declines, but among cyclicals, defensive stocks and European country ETPs, there is very little to choose from.

Finally, just for fun I have added four alternative ETPs with an equity flavor (SPLV, PBP, CWB and PFF) to show how low volatility, covered call, convertible bond and preferred stock ETPs have fared.

Related posts:

Disclosure(s): none

Thursday, May 16, 2013

ETPs Turn to Selling Options to Generate Income

Not long after I penned The Options and Volatility ETPs Landscape, Credit Suisse (CS) added another buy-write / covered call ETP to the mix: the Credit Suisse Silver Shares Covered Call ETN (SLVO).

With SLVO, Credit Suisse is essentially extending the methodology they pioneered with the Credit Suisse Gold Shares Covered Call ETN (GLDI). In the case of both GLDI and SLVO, the ETPs are selling covered calls against the underlying commodity ETF for gold (GLD) and silver (SLV) in an effort to generate some income, and in so doing, choosing to forego some upside potential. In both instances, the ETP starts selling covered calls with 39 days until expiration and completes the sales with 35 days to expiration. One month later, the ETP buys these covered calls back over a period ranging from five to nine days prior to expiration. The net proceeds of these covered call transactions are then paid out as a monthly dividend. This dividend payment is not guaranteed and can fluctuate substantially from month to month. In the first four months following its launch, the monthly dividend for GLDI has been 0.1146, 0.0724, 0.1319 and 0.0572.

As silver is generally much more volatile than gold, SLVO elects to sell calls that are 6% out-of-the-money, while GLDI sells calls that are only 3% OTM. Other than this difference in strike selection or moneyness, the strategies employed by GLDI and SLVO are essentially the same.

Of course, covered call strategies work best when the price of the underlying is flat or when the underlying is appreciating slowly. During the recent sharp drop in GLD and SLV, the covered calls did provide a small amount of downside protection, but with GLD falling 13% over the course of just two trading days last month, the downside protection offered by a covered call was barely more than a rounding error. Covered calls and buy-write strategies generally outperform a long position in the underlying in all instances except when the underlying experiences a strong bull move.  (See graphic below for details.)

Thinking more broadly, the introduction of GLDI and SLVO should reinforce the idea that with ETPs now spanning a wide variety of asset classes and alternative investments, covered call strategies can be implemented in many non-traditional ways. The most popular of the traditional methods is PowerShares S&P 500 BuyWrite (PBP), which sells covered calls against the popular equity index. There is no reason, however, why there cannot be a similar product that sells covered calls against more volatile groups or sectors, such as emerging markets (EEM), small caps (IWM) or semiconductors (SMH), just to name a few. One can even bring alternative assets under the covered call tent. I’m not talking just about the likes of crude oil, copper or corn, but why not have covered calls on real estate, currencies or even volatility ETPs?

Better yet, why stop at covered calls? A strategy that I have discussed here on a number of occasions is selling cash-secured puts. The recent launch of U.S. Equity High Volatility Put Write Index ETF (HVPW) brought the put-write strategy into the ETP marketplace.  It is unfortunate that put-write strategies have not found a wider audience at this point or they too would be ripe for extending beyond the comfortable confines of the S&P 500 index.

Assuming this market eventually stops going up almost every day, investors are going to have to look for other ways to grow their portfolio and the scramble for yield will no doubt intensify. With ETPs now selling options to generate income, investors may want to look at some of the shrink-wrapped products mentioned above or consider how they might wish to implement similar strategies on their own.

[source(s): StockCharts.com]

Related posts:

Disclosure(s): long GLDI and HVPW at time of writing

Sunday, October 3, 2010

Chart of the Week: Visualizing the Flash Crash

This week the allied forces of the SEC and CFTC released their joint report on the ‘flash crash’ with the title of Findings Regarding the Market Events of May 6, 2010.

While many were underwhelmed by the report, it provides traders with a sense of some of what happened during a day in which the Dow Jones Industrial Average fluctuated some 1138 points.

The chart of the week below shows what happened to IWM, the highly liquid ETF for the Russell 2000 index. IWM trades more than 60 million shares per day and is regularly one of the most active issues traded. Up until 2:43 p.m. ET, IWM was acting normally. Then as the price (dashed line, right scale) began to accelerate downward, liquidity (green and blue bands, left scale) suddenly began to dry up. By 2:46 p.m., market depth (the height of the green and blue bands) in IWM had almost completely disappeared. Over the course of the 74 minutes left in the normal trading session, liquidity began to return slowly to the markets. At the time the markets closed, approximately 60% of the normal market depth from earlier in the day had returned to IWM.

The report linked above has some interesting graphics surrounding trading in ACN, PG, MMM, IBM, AAPL, GE and IWM beginning on page 91 of the PDF. If anything, the action in IWM is the least extreme of the group.

If you have some time, the report is worth at least a scan.

Related posts:


[source: SEC and CFTC]

Disclosure(s): none

Tuesday, August 10, 2010

What a Difference a Weekly Makes

Last week I made my first trade using weekly options. Part of the reason I am so excited about weeklys is that I would not have made the trade had only standard monthly options been available.

Last Monday, after the markets had jumped more than 2%, I was of the opinion that we would have choppy trading on Tuesday through Thursday, as investors chose to sit on the sidelines in advance of Friday’s nonfarm payrolls report.

My trade of choice was a short straddle and my preferred underlying was IWM, the iShares Russell 2000 Index ETF. When I looked at the available options, the weeklys almost jumped off of the page, with superb liquidity and much higher implied volatility. As the intent of my trade was to take maximum advantage of time decay (theta), choosing the weeklys were a no-brainer.

A look at the chart below shows the difference in IV between the IWM weekly options that expire this Friday (red line) and the standard monthly options that expire the following week (yellow line.) All things being equal (and they never are) the higher implied volatility of the shorter-dated weeklys translates into substantially higher time decay.

So…if you are comfortable trading options that are toward the end of the expiration cycle, take a close look at the weeklys. If you are not comfortable doing this (controlling gamma risk is critical), then perhaps future posts on weekly options will assist in this regard.

For more on related subjects, readers are encouraged to check out:


[source: Livevol Pro]

Disclosure(s): long IWM at time of writing; Livevol is an advertiser on VIX and More

Monday, August 9, 2010

Weekly Options Gain Momentum

Up until a couple of weeks ago, it was almost impossible to find anyone who thought it was worthwhile to mention weekly options: options that have the same terms as standard monthly options, except that they expire on every Friday other than the third Friday of the month (which is when standard monthly options expire.)

For those who find the definition above a little too sparse, the CBOE has an excellent FAQ for weeklys; the Options Industry Council (OIC) also has a weekly options FAQ for those who wish to learn a little more about these products.

Some of my fellow bloggers have already taken up the cause of weekly options and have shared some of their initial thinking on the subject:

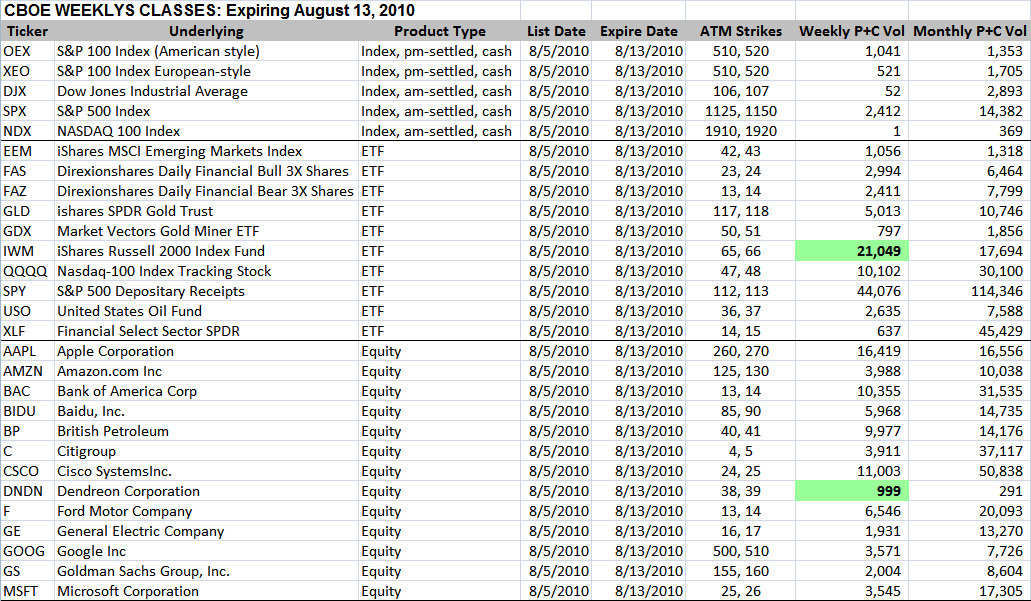
Before anyone gets too excited about new products, one of the first questions is invariably about liquidity and market depth. Rest assured, there is already substantial liquidity and market depth in the weekly options being offered. In the table below, I have calculated today’s volume in weekly options and standard options for the two at-the-money strikes for all the weeklys listed by the CBOE. Note that for the most part, the weekly options volumes are running at about one third to one half of the rate of the standard monthly options. In the case of IWM and DNDN, today’s weekly volume exceeded the volume in the monthly options.

For the record, I made my first weekly option trade last week and I was excited because it was a trade I never would have made unless it was near the end of an expiration cycle – a time frame many options traders avoid, but I like to embrace. Given the increasing popularity of weekly options and new end-of-cycle trading opportunities, I would recommend that anyone who has not already done so to spend some time with Jeff Augen’s excellent Trading Options at Expiration, where many of Jeff’s ideas can now be applied on a weekly basis.

I will have a lot to say about weeklys (blame the CBOE for the spelling choice) going forward. In the meantime, readers looking to learn more about these products should start with the CBOE Weekly Options splash page.


[source: CBOE, Livevol Pro]

Disclosure(s): long IWM at time of writing; both the CBOE and Livevol are advertisers on VIX and More

Wednesday, February 3, 2010

Fidelity Offering 25 iShares ETFs Commission Free

Mutual fund giant Fidelity has largely sidestepped the ETF revolution, but the company fired in important competitive salvo when they announced that starting today 25 iShares ETFs will be available for trading through Fidelity on a commission-free basis.

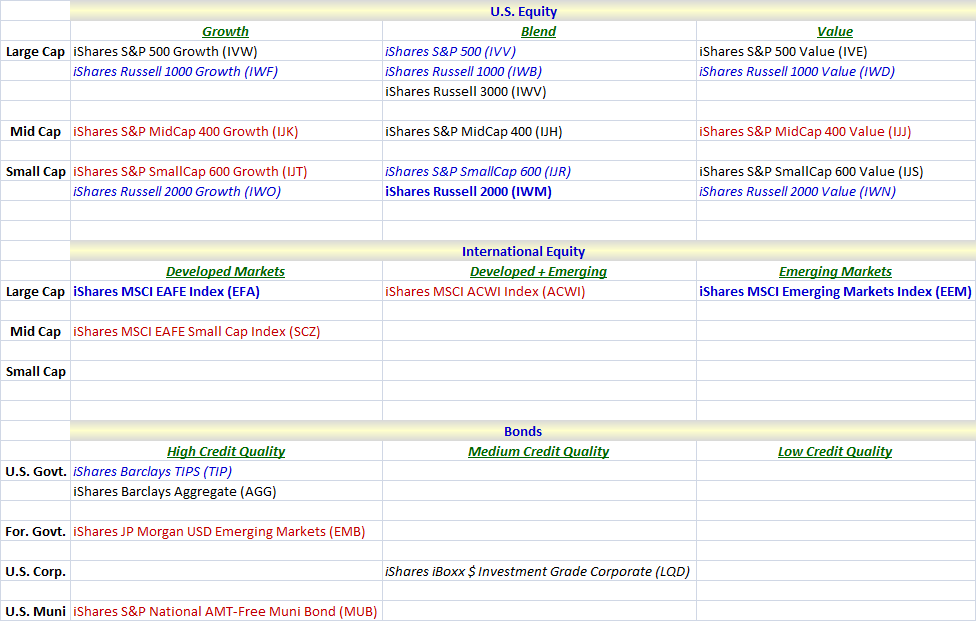
The 25 ETFs include 16 U.S. equity index ETFs, 4 ETFs based on international equity indices and 5 bond ETFs that cover a broad range of issuers, geographies and credit quality. The table below attempts to slice and dice these commission-free ETFs in a an way that should help investors who are unaware of some or all of these ETFs better understand their characteristics.

Included in the Fidelity/iShares 25 are three heavyweights that I have highlighted on bold blue font. Each of these ETFs trades 20 million shares or more per day on average and has a highly liquid options market. In fact, EEM and IWM are among the top five most actively traded ETFs. In addition to these three heavyweights, I have also highlighted in italicized blue font the eight other ETFs in this group which trade an average of at least 1 million shares per day. The next most liquid ETFs are in black font. Finally, I have reserved the red font for the seven ETFs that do not have options associated with them. Not surprisingly, the underlying ETFs are also among the least liquid of the group.

In terms of groupings, I have divided the ETFs into three high level categories: U.S. equity; international equity; and bonds categories. For the U.S. equity ETFs, I have further subdivided these ETFs into Morningstar style box categories. For international equity ETFs, I decompose these according to market cap and developed/emerging market exposure. Finally, for bond ETFs, these are broken down by issuer and credit quality.

Investors who have shied away from transaction-intensive strategies because of commission costs may now want to rethink some of those ideas in the context of the Fidelity/iShares commission-free ETFs. As for options traders, some stock-option strategies such as buy-writes now may deserve another look as well.

For related posts on these subjects, readers are encouraged to check out:


Disclosures: none

Wednesday, June 3, 2009

ETFs, Leverage and Strangles

I was surprised by the volume of the feedback I received from last week’s Using Options to Control Risk in Leveraged ETFs. Clearly there is a great deal of interest in options and leveraged ETFs.

Among the emails I received were several questions about strategies associated with ETFs. For the record, my intent here is not to advocate a particular strategy, but merely to illuminate various strategic building blocks that I believe should be part of the trading arsenal of any options trader.

With that out of the way, let me spend a minute talking about strangles. I realize I have not talked about strangles as much as straddles here, but I actually prefer to trade strangles instead of straddles when I am selling options. Whereas, the point of maximum profit for a straddle is a point that often resembles a Sisyphean lottery, strangles have a maximum profit zone that is much wider and easier to manage.

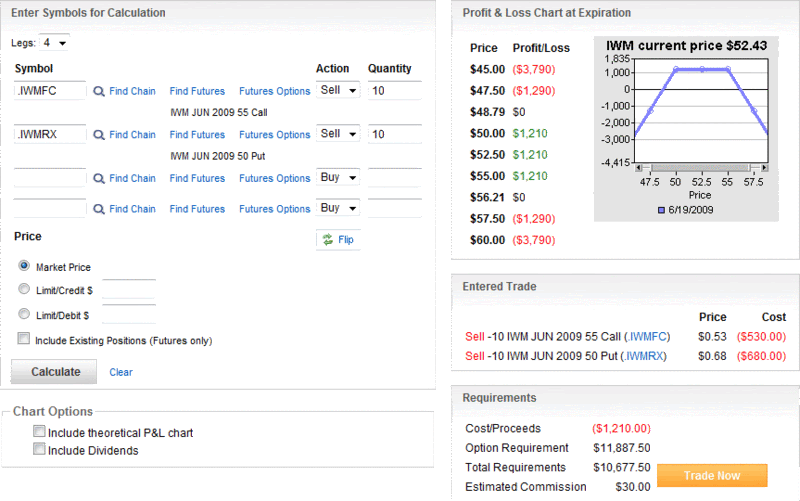
In the chart immediately below, I have taken a snapshot of a short strangle on IWM, which is an ETF for the Russell 2000 small cap index. The short strangle is created by selling 10 June 50 puts and selling 10 June 55 calls. In this example, the puts have an implied volatility of 37 and the calls have an implied volatility of 31. Note that the maximum profit on this short strangle is $1210 and occurs if IWM closes anywhere from 50 to 55 at expiration. The full profit zone spans 7.92 points from 48.79 to 56.71.

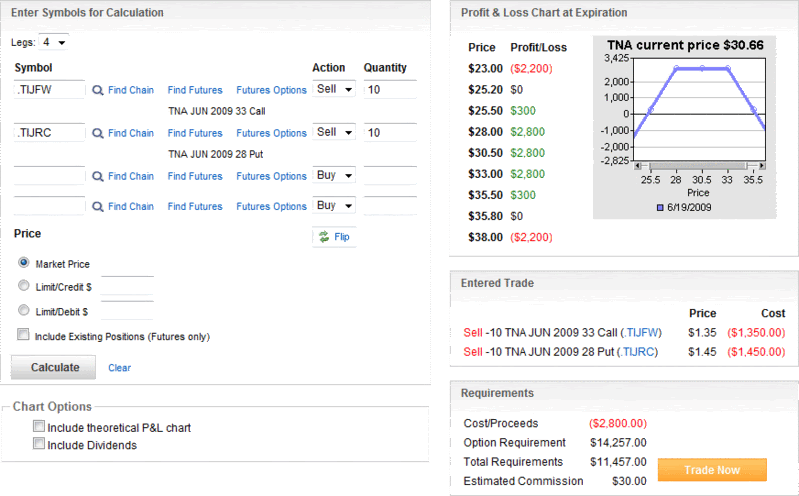
TNA is a 3x ETF for the same Russell 2000 small cap index. Whereas IWM closed at 52.43, TNA closed at 30.66, a little more than 41% below its 1x sibling. Even at a significantly lower price, however, the firepower of the 3x ETF is immediately obvious when you look at the options. The chart below shows the result that is created by selling 10 June 28 puts and selling 10 June 33 calls. As in the IWM example, the strikes have a five point interval. The differences in the profit and loss graphic below are largely a result of the extreme differences in volatility. In this example, the puts have an implied volatility of 92 and the calls have an implied volatility of 87 – almost, but not quite, three times that of IWM. As result of the higher volatility, the maximum profit is $2800 (between 28 and 33), while the full profit zone is 10.60 points, from 25.20 to 35.80.

In brief, for an implied volatility that is about 2.6 times higher, TNA offers a maximum profit that is 2.3 times greater and profit zone that is 1.3 times larger.

These comparisons are admittedly less than perfect, given that the IWM and TNA trade at much different prices, but they certainly convey the essence of the idea that in a range-bound market, an options seller who is short options on 3x leveraged ETFs can rack up large gains (or losses) in a hurry. Of course, this same trade can be made much less risky by "buying the wings" and turning the strangle into an iron condor.

For a related post, check out The Options Opportunity Matrix.

[graphics: optionsXpress]

Monday, July 30, 2007

RUT Hedge Fund Puke?

On the off chance that there are readers out there who have not bothered to read Bernie Schaeffer’s market commentary because it requires a free registration to Schaeffer’s Research, you really should rethink that idea. Take, for instance, Schaffer’s “Monday Morning Outlook: Fear Swells Amid Market Pullback,” which was published earlier this morning. Here Schaeffer pulls a gem from Stonebrook Structured Products, a provider of hedge fund replication strategies:

“A large part of hedge fund returns are driven by shorting large-cap growth and the going long small-cap value and emerging market equity. True alpha accounts for only 20-25% of industry returns.”

Schaeffer extends this idea to come up with a hypothesis for the recent substantial performance gap for small caps (as evidenced by the Russell 2000 falling almost three times as hard as the large cap indices):

“Once the more volatile smaller-cap stocks began to seriously under perform the S&P, their short S&P hedges were not sufficiently protecting them (which caused them to be ‘too long’ in a market correction) and the hedge funds then needed to go out and sell stock from their portfolios and/or short the IWM or buy IWM puts. And all of this served to further blast the IWM.”

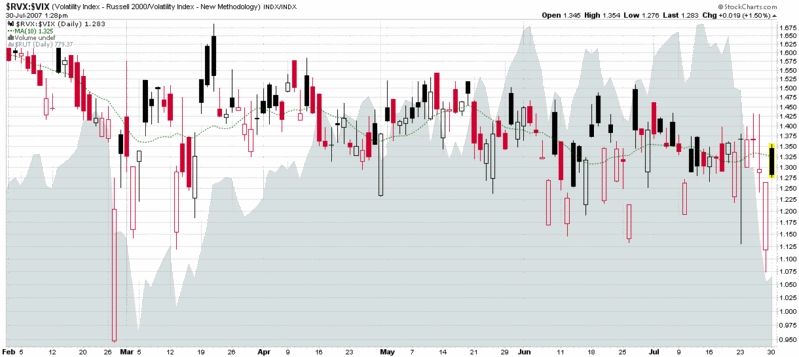
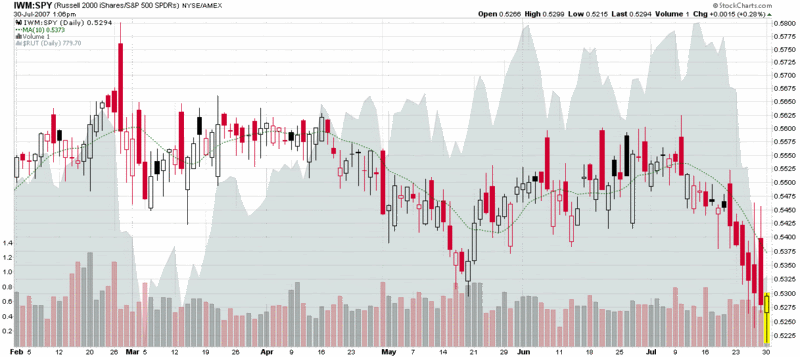
Interestingly, a look at the volatility of the Russell 2000 index (RVX) compared to the VIX does not reveal the underlying dynamic that Schaeffer suggested, but a study of the ratio of the IWM to the SPY does support his contention. See the two charts below for a better sense of this.

One key takeaway from this exercise is that some important volatility-related information is flying under the radar of the volatility indices. Another key takeaway is that ETFs are not only the driving the force in the markets these days, but they need to be a central part of any market technician’s analytical toolbox as well.


DISCLAIMER: "VIX®" is a trademark of Chicago Board Options Exchange, Incorporated. Chicago Board Options Exchange, Incorporated is not affiliated with this website or this website's owner's or operators. CBOE assumes no responsibility for the accuracy or completeness or any other aspect of any content posted on this website by its operator or any third party. All content on this site is provided for informational and entertainment purposes only and is not intended as advice to buy or sell any securities. Stocks are difficult to trade; options are even harder. When it comes to VIX derivatives, don't fall into the trap of thinking that just because you can ride a horse, you can ride an alligator. Please do your own homework and accept full responsibility for any investment decisions you make. No content on this site can be used for commercial purposes without the prior written permission of the author. Copyright © 2007-2023 Bill Luby. All rights reserved.
 
Web Analytics