Showing posts with label SPLV. Show all posts

Tuesday, April 15, 2014

The Correction As Seen in the ETP Landscape

Since stocks bottomed in March 2009, I have periodically been publishing an SPX pullback table and occasionally a plot of all those pullbacks and their duration. The recent selloff in stocks, however, has been anything but an SPX pullback. I toyed with the idea of presenting comparable data for the NASDAQ Composite or NASDAQ-100 Index (NDX), but here again, the selling has been disproportionate in some areas of the NASDAQ universe, even though it has been hit harder than the SPX.

This time around I have opted instead for a chart that shows the peak-to-trough drawdown across the equity ETP universe, focusing on sector groups that I believe are among the most important to watch.

ETP Landscape 2014 DDs 041514

[source(s): Yahoo, VIX and More]

The data above cover only 2014 and indicate the maximum drawdown since the 2014 peak. While many of these maximum drawdowns are from earlier today, there are quite a few instances in which the maximum drawdown was established earlier in the year.

Note that while the NASDAQ gets most of the attention, it is the small caps (IWM) that have suffered the most among the major market index ETPs.

Not surprisingly, biotechnology (IBB), social media (SOCL) and Russia (RSX) have seen the largest declines, but among cyclicals, defensive stocks and European country ETPs, there is very little to choose from.

Finally, just for fun I have added four alternative ETPs with an equity flavor (SPLV, PBP, CWB and PFF) to show how low volatility, covered call, convertible bond and preferred stock ETPs have fared.

Related posts:

Disclosure(s): none

Friday, March 22, 2013

The Low Volatility Story in Pictures

Lately I have not been able to help being bombarded by articles extolling the virtues of investing in low volatility (also known as minimum volatility) exchange-traded products. These ETPs typically talk about the tendency of investors to become overly enamored with some of the sexier, more volatile stocks and accordingly bid these up to unsustainable valuations. On the other hand, the tortoise-like approach to lower volatility stocks tends to avoid these stocks that are fashionable for short periods of times, so-called “story stocks,” momentum favorites, and stocks with hockey-stick charts that sometimes become mini-bubbles. Instead, plodding growth, dividends and total return are the main areas of focus.

I have discussed the most famous of these low volatility ETPs, the PowerShares S&P 500 Low Volatility Portfolio (SPLV) in a number of different contexts in this space, including:

This time around my intent is to let the graphics speak for themselves, so without further ado, I give you three snapshots of the performance of SPLV against the performance against its more volatile sibling, the PowerShares S&P 500 High Beta Portfolio (SPHB).

SPLV vs. SPHB since inception (472 days):

[source(s): StockCharts.com]

SPLV vs. SPHB over the last 380 days:

[source(s): StockCharts.com]

SPLV vs. SPHB over the last 200 days:

[source(s): StockCharts.com]

I realize that every historical period in the financial markets is unique and that one can cherry pick graphics to make any imaginable point, but I think the three charts above tell almost the full story, which is this:

1.  Over the long-term, low volatility stocks have a high probability of outperforming high volatility stocks on an absolute basis and particularly on a risk-adjusted basis

2.  Even in bull markets, the total return approach of low volatility stocks often makes them comparable to or even superior to high volatility stocks

3.  The biggest risk associated with a low volatility approach is being left behind in a sharp bull move, when more defensive sectors can underperform substantially

The real question to ask yourself is which risk concerns you the most: a large drawdown or missing out on a large chunk of a bull rally?

Related posts:
Disclosure(s): none

Wednesday, February 27, 2013

Beyond SPLV: The Expanding Universe of Low Volatility ETPs

The spike in volatility that hit a climax on Monday has apparently passed with the swiftness of a summer thunderstorm. Of course, as I explained more than six years ago in What My Dog Can Tell Us About Volatility, things are never really quite the same after the storm passes, which is why we often encounter a phenomenon I call echo volatility.

Most investors – and I know I am the exception here – do not like volatility and actively seek out strategies that minimize the volatility of their portfolios. This low volatility approach has a great deal of merit and a fair amount of academic studies to support the rationale behind low volatility investing. For those who might not be interested in wading through the academic literature, the chart below shows how SPLV has significantly outperformed SPY since its launch, with substantially less volatility along the way.

Since the exchange-traded revolution began, investors have been blessed with a variety of low volatility sector ETPs, such as utilities (XLU) and consumer staples (XLP) as well as a strong selection of value-oriented ETPs (e.g., IWD and VTV) and dividend-focused ETPs (e.g., VIG, DVY and SDY), but it was not until May 2011 that there was an exchange-traded product that specifically target low volatility holdings. Enter the PowerShares S&P 500 Low Volatility Portfolio ETN (SPLV), which immediately began attracting a following and now has $3.4 billion of assets. SPLV had the benefit of being first to market, but its success has prompted the launch of many similar products, of which the most successful has probably been the iShares MSCI USA Minimum Volatility ETF (USMV). Since then, PowerShares and iShares have expanded their product line of low volatility ETPs to cover international stocks (EFAV,ACWV, IDLV) and emerging markets (EEMV, EELV).

The newest battleground in the low volatility race is a U.S. market cap focus, with the launch by PowerShares of the PowerShares S&P Mid Cap Low Volatility Portfolio (XMLV) ETN and the PowerShares S&P Small Cap Low Volatility Portfolio (XSLV) ETN earlier this month. I mention these two new entrants because the distinction between these two and SPLV is much more than the market cap. Indeed, the differences in sector weighting are at least as substantial as the differences in market cap. Starting with SPLV as a benchmark, here the current sector weightings are 31% utilities, 24% consumer staples and 15% financials. In contrast, XMLV is weighted with 51% financials, 24% utilities and no other sector representing more than 8% of the portfolio. Not too dissimilar is XSLV, which is weighted 50% in financials and 16% in utilities. The bottom line is that these two new products are not just smaller cap versions of SPLV, but portfolios with a strong financial component, very little exposure to consumer staples and more exposure to sectors such as information technology and industrials, so the redundancy between SPLV and either XMLV or XSLV is smaller than one might expect.

Aggressive and conservative investors alike should make an effort to have a portion of their portfolio dedicated to lower volatility instruments. While more traditional sector, value and dividend approaches still make some sense, the expanding menu of targeted low volatility products certainly deserve a long look as well – preferably before the next big volatility storm.


[source(s): ETFreplay.com]

Related posts:
Disclosure(s): none

Friday, June 15, 2012

Performance of Volatility-Hedged ETPs

An emerging area of interest in the markets in general and in this space in particular is the subject of how to blend volatility exposure – both long and short – into a portfolio.

Based upon feedback I have received, three recent articles that have touched upon this subject from different angles have all resonated with readers:

Clearly the role of volatility in a portfolio is a subject that warrants further analysis and discussion.

It is worth noting that issuers of exchange-traded products have taken several approaches to addressing volatility. The most obvious was the launch of VIX-based ETPs, such as the popular VXX (iPath S&P 500 VIX Short-Term Futures ETN,) which is a long basket of short-term VIX futures.

Subsequent products have tackled the subject of volatility in a variety of different ways, including:

  1. Utilize low beta stocks to minimize portfolio volatility (SPLV)
  2. Employ a market timing mechanism that dynamically allocates between stocks and bonds according to measures of market volatility (VSPY)
  3. Employ a market timing mechanism that dynamically allocates between stocks and VIX futures according to measures of market volatility (VQT)
  4. Employ a market timing mechanism that dynamically allocates between long and short volatility positions (XVZ)

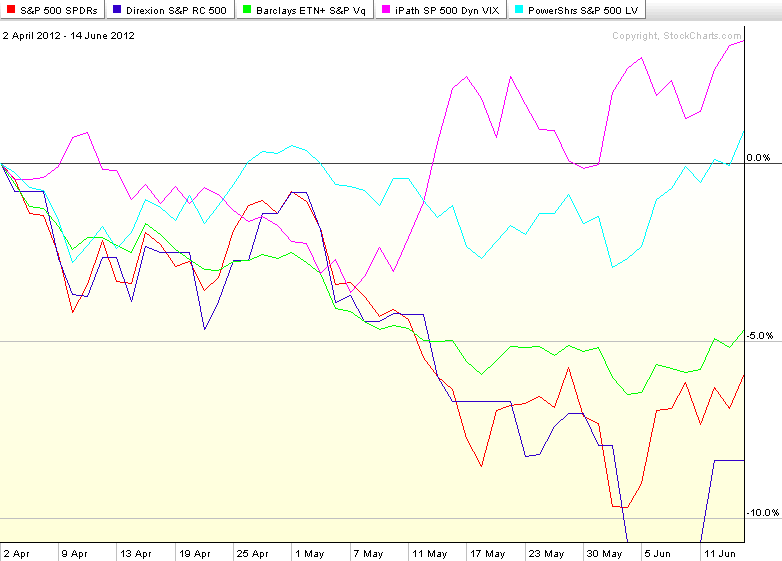
With the S&P 500 index down about 6.3% through yesterday’s close from its April 2nd high, it is reasonable to ask how these approaches have been performing during this bearish phase. The chart below shows the performance of SPY in red. Two of the approaches employed have had a performance trajectory that is almost indistinguishable from that of SPY: VQT (green line); and VSPY (dark blue line), which is thinly traded.

The two standouts during the past 2 ½ months are SPLV (light blue line) and XVZ (purple line). You can see from the graphic that SPLV has done exactly was it is supposed to do: minimize volatility. For the better part of the period in question, SPLV has been largely unchanged. Lately it has risen largely due to its substantial exposure to utilities and consumer staples. The other standout is XVZ, which essentially uses the slope of VIX futures term structure to determine how it allocates between long and short volatility positions. With the VIX futures in contango (front months less expensive than more distant months) since last November, this product has been able to capitalize on negative roll yield, while also providing protection against a spike in the VIX.

While this data should be of interest to traders who are looking for volatility-based hedges or even speculative applications going forward, today is definitely a case where past performance should not serve as a guideline for what to expect in the next week or two.

For those who are looking for more powerful VIX hedges, long positions in VIX calls and VXX calls (including the weeklys) will provide the most robust long volatility hedges. For those who are looking to minimize portfolio volatility going forward, the four approaches outlined above (as well as the links below) should warrant further investigation.

Related posts:

[source(s): StockCharts.com]

Disclosure(s): long XVZ and short VXX at time of writing

Friday, May 25, 2012

Investing with a Target Volatility Approach

Since I mentioned one of my favorite ETP sites earlier today [the more I think about it, the more I have come around to the idea that the Best Post of the Year on Exchange-Traded Products may be the best post I have ever seen on the subject] I thought it might be a good idea to include some functionality with that required weekend reading.

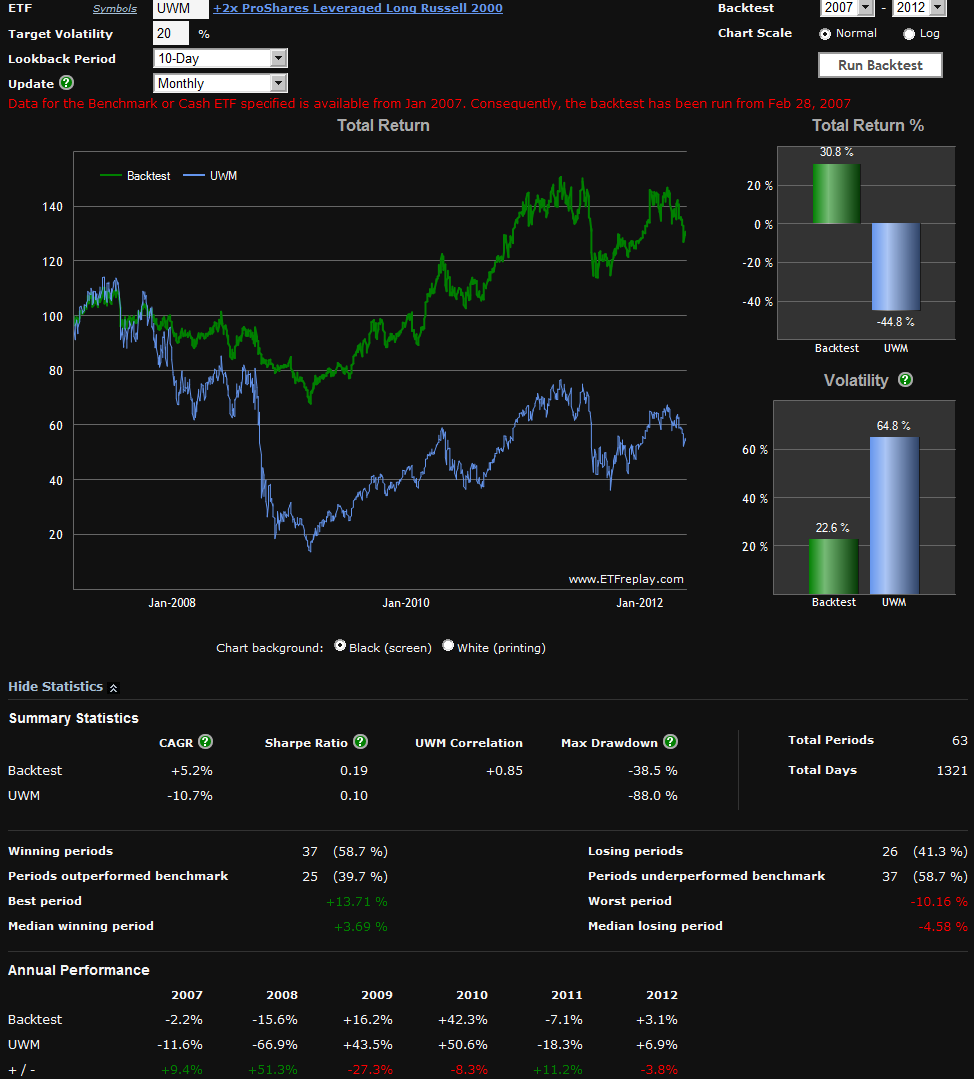
Another superb ETP site, ETFreplay.com, recently launched a Volatility Target Backtest tool. What this tool is designed to do is to demonstrate what historical returns would have looked like if one had taken a high volatility ETP such as a leveraged ETP, a VIX-based ETP, etc. and combined with a dynamic cash allocation and historical volatility data to limit exposure to a target volatility ceiling.

An example may make this easier to visualize. Let’s assume that you are bullish on the Russell 2000 index of small capitalization stocks and want to get some long exposure to these stocks with the +2x leveraged ETP, ProShares Ultra Russell2000 (UWM). Last August, however, the 10-day historical volatility in UWM spiked over 160 and right now it is at 41 – and you decide those levels of volatility are unacceptable, particularly with all the uncertainty in Greece and across the euro zone.

The solution? How about a portfolio that dynamically allocates between UWM and cash, (here using the iShares Barclays 1-3 Year Treasury Bond, SHY), based on 10-day historical volatility data and targets a forward volatility level of 20%.

The graphic below shows the ETFreplay backtest results of such a portfolio, using a monthly rebalancing period and starting in January 2007, when UWM was launched.

Of course past results are no guarantee of how this type of strategy might work in the future (and leveraged ETPs certainly entail a great deal of compounding decay risk for long-term investors), but the graphic is compelling, for both bull and bear markets. Think of this type of approach as a way to fine-tune risky products to a desired volatility level.

Enjoy the long weekend, everyone!

Related posts:

[source(s): ETFreplay.com]

Disclosure(s): none

Wednesday, March 21, 2012

The Dangers of Anticipating a Market Reversal

Raise your hand if you are anticipating a bearish reversal in stocks in the near future. Great. Lots of hands here... Now let’s be honest, how many were also expecting a reversal a week ago? a month ago? ever since the calendar turned to 2012?

Market reversals are notoriously difficult to predict, which is part of the reason why many successful investors stick exclusively to trend following strategies. If one bets on a market reversal such as a correction during a bull market and it doesn’t happen, not only is there a loss associated with a short position, but there is also the opportunity cost of not having participated in the rally.

The worst part of trying to anticipate a market reversal, however, can be the psychological damage. If an investor thinks that a market is overbought or overvalued, then gets short and covers that short after the market continues to rise, they often subsequently have to wrestle with a mental block that makes it even harder to get long in a market that now appears to be even more overbought/overvalued.

So what is a savvy investor to do when he or she believes that stocks have risen too far too fast?

One approach is a stock replacement strategy. This approach consists of selling existing long holdings and replacing these with equivalent long call positions (1 contract for every 100 shares held.) A stock replacement strategy allows an investor to participate in any subsequent bullish moves, yet limits losses to the cost of the options purchased. While all stocks and other securities do not have options associated with them, there are always index options and options on a wide range of exchange-traded products (ETPs) available that are close approximations for the original holding.

For investors who think stocks are more likely to tread water than correct sharply, covered calls (or buy-write strategies) are an appropriate strategic choice. Here there are ETPs which can execute such strategies, the most popular of which is the PowerShares S&P 500 BuyWrite Portfolio ETF (PBP).

A third approach might be to rotate into less volatile holdings such as the popular PowerShares S&P 500 Low Volatility Portfolio ETN (SPLV).

Investors who are looking to hedge their existing long equity positions without rotating into options, covered calls or low volatility holdings might want to review my recent Dynamic VIX ETPs as Long-Term Hedges, which focuses on VQT and XVZ.

Quite a few talented investors have missed out on the 2012 rally and despite what you hear on CNBC or read in your favorite financial publication, there is no guarantee we will get a big pullback anytime soon. In the meantime, there are a number of approaches that will allow investors to benefit from any continued bull moves, while minimizing downside risk. In addition to some of the approaches outlined above, the links below should be a good source of information for explaining some alternative approaches as well as the nature of the recent market moves.

Related posts:

Disclosure(s): long PBP and XVZ at time of writing

Friday, March 2, 2012

Dynamic VIX ETPs as Long-Term Hedges

With the huge contango in the VIX futures term structure at the moment, anyone who is buying VIX options or the VIX exchange-traded products (ETPs) right now is having to pay for that contango in order to have the opportunity to capitalize on increasing volatility. With the contango-based negative roll yield currently running at 15% per month, this means the cost of a volatility hedge for long equity positions is extremely expensive in the current market.

Fortunately, investors do have some alternatives that have a different type of appeal.

There are two VIX ETPs, VQT and XVZ, which attempt to minimize the impact of the negative roll yield by using a market timing mechanism that dynamically adjusts the long volatility exposure. In more volatile markets, the exposure increases; in less volatile markets, the long volatility exposure is either very low (in the case of VQT) or can even flip to a small net short position (in the case of XVZ).

VQT is more of a portfolio replacement strategy, while XVZ is more of a portfolio augmentation strategy. Specifically, VQT has long SPY exposure that ranges from 60% to 97.5% of its portfolio, with the balance (2.5% - 40%) allocated to a long position in the VIX short-term futures (think VXX). The links below will provide more details.

XVZ, on the other hand, does not hold any long equity component, only short-term (again, think VXX) and mid-term (think VXZ) VIX futures. The twist here is that while the mid-term VIX futures component can range from 50-100% of the portfolio, the short-term component can be as high as 50%, but as low as negative 30%. So…under certain circumstances (e.g., a very steep VIX futures term structure, like the one we are currently experiencing), the portfolio will consist of the equivalent of a 30% short position in VXX and a 70% long position in VXZ. On balance, that type of portfolio should be very close to volatility neutral and in some cases even have a slight short volatility bias.

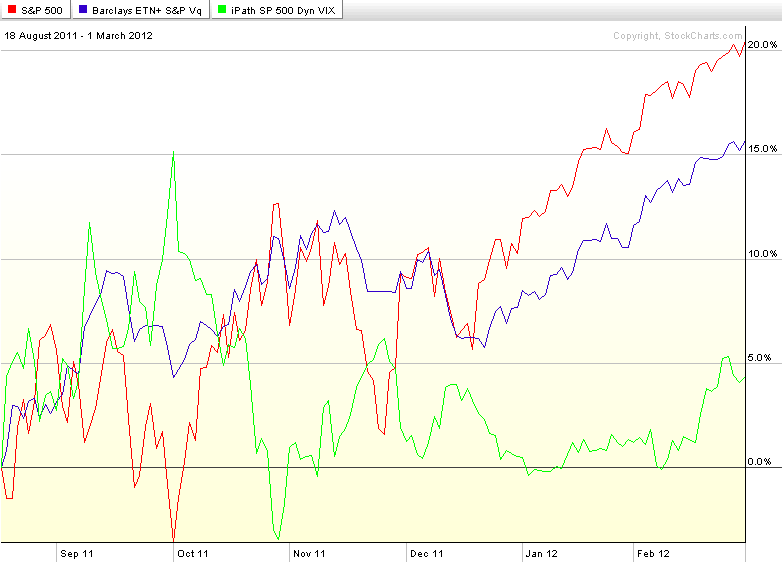
Since XVZ was only launched on August 18, 2011 (VQT dates back to September 2010), I have chosen a graphic that shows the relative performance of the SPX (red line), VQT (blue line) and XVZ (green line) from the launch of XVZ to the present. Note that with its long exposure, VQT is better able to take advantage of a low volatility slow bull market. XVZ, on the other hand, is generally close to flat in a low volatility bull market, but should the VIX spike sharply higher, XVZ will likely do a better job of capitalizing on the volatility spike.

As investors ponder the fatigued bulls and inevitable pullback sometime in the near future, certainly VQT and XVZ warrant a more detailed investigation, along with some of the non-volatility ETPs that are meant to reduce risk and hedge against a downturn, such as VSPY, SPLV, and others.

Related posts:

[source(s): StockCharts.com]

Disclosure(s): long XVZ and short VXX at time of writing

Wednesday, January 18, 2012

SPLV vs. XLP

The more I think about it, the less I understand the need for even more low volatility ETPs. Sure, I understand that in high volatility markets many investors want a more conservative portfolio that is insulated against sharp moves in the wrong direction.

In that respect, I can somewhat understand the appeal of the hugely popular PowerShares S&P 500 Low Volatility Portfolio ETN (SPLV), which has now attracted more than $1 billion in assets in the eight months since it launched. Just last week, in Comparing SPLV and VQT, I noted that SPLV’s approach to lower volatility “is heavy on defensive stocks, with the current top sector allocations in utilities, consumer staples and health care stocks.” In fact, following its recent quarterly rebalancing, SPLV currently has approximately 31% of its portfolio invested in utilities, with another 30% in consumer staples. [see SPLV’s top holdings here]

So what is it that SPLV offers over and above an investment in a utilities ETF like XLU or a consumer staples ETF like XLP? Not much, as far as I can tell. I terms of performance, XLU trounced SPLV throughout 2011 and as the chart below shows, finding a distinction between the performance of SPLV and XLP since the former’s launch last May looks a lot like splitting hairs – though to be fair the gap may become more obvious with the recent rebalancing.

One can argue that other approaches which use low volatility stocks (e.g., XLU) are at least as effective in lowering volatility, as are those ETPs that use a dynamic hedging allocation based on an evaluation of market volatility and risk. I touched on two of these in Comparing SPLV and VQT, notably VQT and VSPY.

As I see it, jumping on the low volatility bandwagon is a lot like shunning air travel because of a fear of turbulence. While that is understandable, that cross-country train is going to make it a much longer trip to get to the same destination.

Considering the differences across the investment universe, I realize that not everyone embraces market volatility as a period in which enhanced opportunities arise, so in 2012 one of the themes I will periodically address in this blog will be how to reduce risk, hedge and generate income – though not necessarily all at the same time.

In the meantime, consider for a moment a personal motto, “In volatility, there is opportunity!

Related posts:

[source(s): ETFreplay.com]

Disclosure(s): none

Friday, January 13, 2012

Comparing SPLV and VQT

Based on some of the questions and comments that came out of Wednesday’s Three New Risk Control ETFs from Direxion, there appears to be a significant portion of the investment community that is uncertain about just how some ETPs are attempting to dampen volatility and control risk.

Today I am going to differentiate between three types of risk control approaches and compare two ETPs that have a little performance history. The approaches and an example ETPs are as follows:

  1. Using low beta stocks to minimize portfolio volatility (SPLV)
  2. Using a market timing mechanism that dynamically allocates between stocks and bonds according to measures of market volatility (VSPY)
  3. Using a market timing mechanism that dynamically allocates between stocks and VIX futures according to measures of market volatility (VQT)
While it may be partly semantics, I would not call SPLV a hedge in the sense that it does not attempt to hold securities that are negatively correlated with stocks. Instead, this approach is heavy on defensive stocks, with the current top sector allocations in utilities, consumer staples and health care stocks (see SPLV’s top holdings here.)

On the other hand, the approaches employed by VSPY and VQT are hedges in the traditional sense in that they switch into asset classes (bonds and volatility) that are generally negatively correlated with stocks when measures of volatility such as implied volatility and historical volatility signal an environment that poses greater risk to long equity positions.

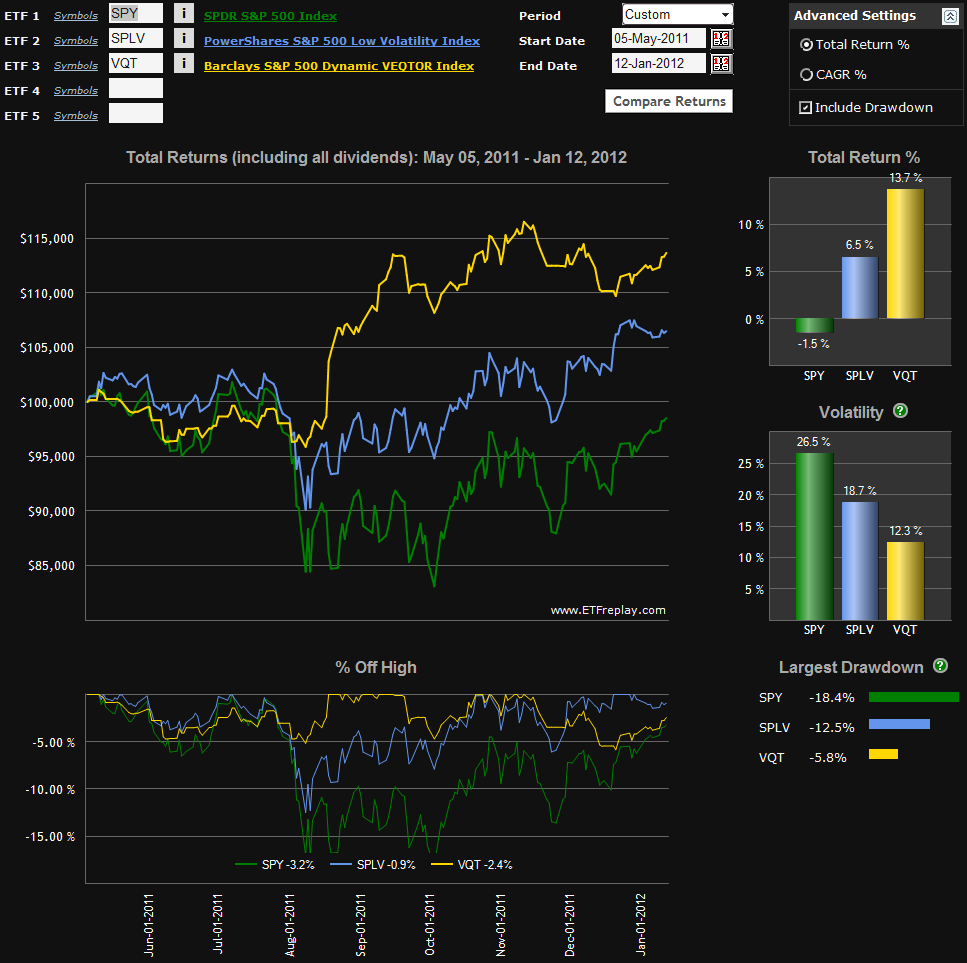
As VSPY was just launched this week, it is too early to talk about the performance of this approach, but the chart below captures the performance of both SPLV and VQT since the launch of the former on May 5, 2011.

Note that both SPLV and VQT are less volatile than SPY, had a lower drawdown, had a smaller peak to trough drawdown during the August-October selloff, and dramatically outperformed SPY during the period covered by the chart. Once VSPY establishes some meaningful historical data, I will return to this subject and offer a more detailed comparison of all three approaches to controlling risk.

For those interested in pursuing some of these subjects further, there is a good deal of information in the links below.

Related posts:
 
[source(s): ETFreplay.com]


Disclosure(s): none

Wednesday, January 11, 2012

Three New Risk Control ETFs from Direxion

Today Direxion announced they have launched three ETFs whose intent is to match their exposure to an underlying equity index based upon current levels of market volatility. The new ETFs are as follows:

  • Direxion S&P 500 RC Volatility Response Shares (VSPY)
  • Direxion S&P 1500 RC Volatility Response Shares (VSPR)
  • Direxion S&P Latin America 40 RC Volatility Response Shares (VLAT)

The launch of these ETFs expands Direxion’s stable of what they call “rules-based index ETFs,” which began with two ETFs that are based on insider trading data: INSD and KNOW. The three new ETFs also arrive just five days after S&P announced a new S&P Dynamic Rebalancing Risk Control Index Series, which provides the basis for evaluating volatility and matching equity exposure to anticipated risk.

The intent of these ETFs is spelled out by Direxion:

“The Funds embody a rules-based investment approach that uses volatility as a gauge to determine equity exposure. They operate according to the principle that exposure to equities should be reduced during periods of higher overall market volatility, and increased during periods of a more stable (lower volatility) market environment. Each Fund has a target volatility level for its corresponding index. When volatility moves above those levels, the Funds will increase their exposure to U.S. Treasuries and decrease their exposure to equities. The Funds will proportionately increase exposure to equities during periods of low market volatility.”

Readers with sharp memories may recall that back in July 2010, Direxion was the first ETF provider to announce that they would be launching a product based on the S&P 500 Dynamic VEQTOR Index, which was an effort to mitigate risk with a dynamic allocation of VIX short-term futures, essentially the equivalent of sizing a VXX hedge based on observed levels of implied volatility and historical volatility. I am not sure why Direxion’s VEQTOR product never saw the light of day, but Barclays ended up with one of the few successful VIX ETPs in 2011 (see VIX Exchange-Traded Products: The Year in Review, 2011) with its Barclays ETN+ S&P VEQTOR ETN (VQT) product, which I made a strong case for back in October 2010 in The Case for VQT.

One of the interesting aspects of the approach taken by VSPY, VSPR and VLAT is that these products will tend to have minimum exposure when the VIX is at its highest – and as anyone who has ever looked a chart of the VIX and SPX/SPY knows, this is typically when stocks bottom and begin a sharp bullish move.

With impeccable timing, EconomPic Data just happened to publish a study yesterday, VIX as a Predictor of Equity Returns, which concluded that for the most part, SPY daily returns were much higher with an elevated VIX than with a historically low VIX.

All this raises the question of how to play increased volatility and risk. In the land of ETPs, there are quite a few alternatives, including:

  • Barclays ETN+ S&P VEQTOR ETN (VQT) – dynamically hedge with a long VIX futures position
  • Direxion’s VSPY and VSPR to dynamically adjust exposure to equities
  • PowerShares low volatility (SPLV) and high beta (SPHB) approaches for manual market timing
  • ETRACS Fisher-Gartman Risk On ETN (ONN) and ETRACS Fisher-Gartman Risk Off ETN (OFF) – for those who wish to manually time the multi-asset class risk on/risk off trade

Investors who believe they are more adept at timing the market may prefer to avoid the rules-based products that dynamically adjust exposure based on a static risk measurement mechanism. For those who prefer not to watch their portfolio closely or are not convinced that they can do a better job than the likes of VQT, VSPY and perhaps SPLV, the new category of dynamic risk exposure products should provide some excellent tools for portfolio augmentation and in some cases, portfolio replacement.

Related posts:

Disclosure(s): short VXX at time of writing

Wednesday, December 14, 2011

High and Low Volatility ETPs

Since Barclays/iShares launched the first VIX-based exchange-traded products (ETPs) three years ago next month, the landscape of volatility ETPs has been dominated by products that are based on VIX futures. This should come as no surprise to investors, since the cash VIX (or VIX index quoted on CNBC and elsewhere) cannot be traded directly.

In early May, however, PowerShares elected to go in a different direction and launched the PowerShares S&P 500 Low Volatility Portfolio (SPLV) on one end of the spectrum and the PowerShares S&P 500 High Beta Portfolio (SPHB) at the more volatile end of the spectrum. [I’m guessing that a “High Volatility” moniker didn’t make it very far with either the legal or marketing folks…]

Three weeks after the PowerShares products, Russell Investments peppered the market with a launch of ten different “factor ETFs” which also address investor demand for products with high and low volatility, beta, momentum, etc. over the Russell 2000 and Russell 1000 universe, later followed by three international variants. Since then, several other issuers have entered the market with similar products.

By far the products that have received the most attention from investors have been the low volatility ETPs, with SPLV leading the pack with a market share of around 80%.

So far these volatility/beta ETPs have attracted approximately $800 million in assets, about 1/3 of the amount that is invested in VIX-based ETPs.

While the low volatility products have performed quite well since their launch and I understand the visceral desire to hold low volatility products in a high volatility world, as I see it, holding low beta stocks (SPLV top holdings) is just another way at market timing and not necessarily better over the long haul than diversifying with bonds or even more cash.

Going forward, I will spend some time analyzing the performance of SPLV, SPHB and some other ETPs in the volatility/beta group. In the meantime, give some thought to the possibility that even though utilities (XLU) have been superb performers in 2011, these are not necessarily the best long-term investments for most of us.

Disclosure(s): none

DISCLAIMER: "VIX®" is a trademark of Chicago Board Options Exchange, Incorporated. Chicago Board Options Exchange, Incorporated is not affiliated with this website or this website's owner's or operators. CBOE assumes no responsibility for the accuracy or completeness or any other aspect of any content posted on this website by its operator or any third party. All content on this site is provided for informational and entertainment purposes only and is not intended as advice to buy or sell any securities. Stocks are difficult to trade; options are even harder. When it comes to VIX derivatives, don't fall into the trap of thinking that just because you can ride a horse, you can ride an alligator. Please do your own homework and accept full responsibility for any investment decisions you make. No content on this site can be used for commercial purposes without the prior written permission of the author. Copyright © 2007-2023 Bill Luby. All rights reserved.
 
Web Analytics