Showing posts with label covered calls. Show all posts

Sunday, December 27, 2015

Enhancing Performance with Low Volatility ETPs

One theme that I will spend more time on in 2016 and beyond is the low volatility anomaly, which has been discussed in considerable detail in the academic world, leading to papers such as the following:


In a nutshell, the research supports the claim that low volatility and low beta stocks in the United States and across the globe outperform high volatility and high beta stocks, with low volatility stocks generating substantially higher risk-adjusted returns.

Not coincidentally, the groundswell of research pointing to outperformance by low volatility stocks has created a land rush for low volatility ETPs in the first generation of “smart beta” or factor-based investment products in ETP wrappers.  Since I believe smart beta or factor-based ETPs is one of the key revolutionary ideas to appear in the investment world in recent memory, I will have a great deal to say about this subject and the many tangential ideas that arise from it going forward.  After nine years focusing primarily on the VIX, volatility and related subjects, it is time to charge off in some new directions, starting with some that have a whiff of volatility and ETP innovation.

For now I am going to be content with updating a February 2013 post, with the title The Options and Volatility ETPs Landscape.  At that time, I wanted to capture those ETPs which employed a buy-write / covered call approach, employed a put-write strategy, focused on the convertible bond space or targeted low volatility stocks.  Well, a lot has changed in the past three years, notably in the low volatility space.  This time around, I have some enhancements to the options and volatility ETPs graphic.  As is the case with The Current VIX ETP Landscape, I have added yellow stars for those ETPs with an average daily volume of 1,000,000 or higher and pink stars for ETPs with an average daily volume between 100,000 and 1,000,000.  Additionally, I have highlighted the new currency-hedged crop of low volatility ETPs by using a red font and have captured the demise of HFIN, a financials buy-write ETF that closed in March 2015 with a X-HFIN designation. 


[source(s): VIX and More]

There are a number of other sub-categorizations I will delve into at a future data, but note that whereas FTHI is a buy-write only, FTLB adds an out-of-the-money put.  Three other relatively new arrivals, CFO, CDC and CSF, are structured so that they will hold up to 75% of portfolio assets in cash in adverse market conditions.  Another intriguing new entrant, SLOW, attempts to avoid sector bias by forcing greater sector diversification than most other low volatility ETPs.

So if you found 2015 volatility to be daunting and are looking to dampen volatility in your portfolio in 2016 or tap into the performance benefits of the low volatility anomaly, keep the list above in mind.  While comprehensive and including many ETPs with marginal liquidity, this list may not touch upon some of the many new and illiquid products that might be flying under the radar.

Related posts:


Disclosure(s): none

Thursday, May 16, 2013

ETPs Turn to Selling Options to Generate Income

Not long after I penned The Options and Volatility ETPs Landscape, Credit Suisse (CS) added another buy-write / covered call ETP to the mix: the Credit Suisse Silver Shares Covered Call ETN (SLVO).

With SLVO, Credit Suisse is essentially extending the methodology they pioneered with the Credit Suisse Gold Shares Covered Call ETN (GLDI). In the case of both GLDI and SLVO, the ETPs are selling covered calls against the underlying commodity ETF for gold (GLD) and silver (SLV) in an effort to generate some income, and in so doing, choosing to forego some upside potential. In both instances, the ETP starts selling covered calls with 39 days until expiration and completes the sales with 35 days to expiration. One month later, the ETP buys these covered calls back over a period ranging from five to nine days prior to expiration. The net proceeds of these covered call transactions are then paid out as a monthly dividend. This dividend payment is not guaranteed and can fluctuate substantially from month to month. In the first four months following its launch, the monthly dividend for GLDI has been 0.1146, 0.0724, 0.1319 and 0.0572.

As silver is generally much more volatile than gold, SLVO elects to sell calls that are 6% out-of-the-money, while GLDI sells calls that are only 3% OTM. Other than this difference in strike selection or moneyness, the strategies employed by GLDI and SLVO are essentially the same.

Of course, covered call strategies work best when the price of the underlying is flat or when the underlying is appreciating slowly. During the recent sharp drop in GLD and SLV, the covered calls did provide a small amount of downside protection, but with GLD falling 13% over the course of just two trading days last month, the downside protection offered by a covered call was barely more than a rounding error. Covered calls and buy-write strategies generally outperform a long position in the underlying in all instances except when the underlying experiences a strong bull move.  (See graphic below for details.)

Thinking more broadly, the introduction of GLDI and SLVO should reinforce the idea that with ETPs now spanning a wide variety of asset classes and alternative investments, covered call strategies can be implemented in many non-traditional ways. The most popular of the traditional methods is PowerShares S&P 500 BuyWrite (PBP), which sells covered calls against the popular equity index. There is no reason, however, why there cannot be a similar product that sells covered calls against more volatile groups or sectors, such as emerging markets (EEM), small caps (IWM) or semiconductors (SMH), just to name a few. One can even bring alternative assets under the covered call tent. I’m not talking just about the likes of crude oil, copper or corn, but why not have covered calls on real estate, currencies or even volatility ETPs?

Better yet, why stop at covered calls? A strategy that I have discussed here on a number of occasions is selling cash-secured puts. The recent launch of U.S. Equity High Volatility Put Write Index ETF (HVPW) brought the put-write strategy into the ETP marketplace.  It is unfortunate that put-write strategies have not found a wider audience at this point or they too would be ripe for extending beyond the comfortable confines of the S&P 500 index.

Assuming this market eventually stops going up almost every day, investors are going to have to look for other ways to grow their portfolio and the scramble for yield will no doubt intensify. With ETPs now selling options to generate income, investors may want to look at some of the shrink-wrapped products mentioned above or consider how they might wish to implement similar strategies on their own.

[source(s): StockCharts.com]

Related posts:

Disclosure(s): long GLDI and HVPW at time of writing

Thursday, February 28, 2013

The Options and Volatility ETPs Landscape

For several years I have publishing a graphical overview of the VIX ETPs landscape, with all the ETPs plotted on the basis of leverage and target maturity, such as the recent VIX ETP Returns for 2012.

Lately, however, an expanding crop of options and volatility ETPs has been taking root in a space that is closer to the VIX products than any of the other ETPs. I talked about the low volatility ETPs at some length in yesterday’s Beyond SPLV: The Expanding Universe of Low Volatility ETPs.

The graphic below is a plot of these securities, with the their geography, market cap and asset class in the rows and strategy/approach in the columns. I have talked about PBP in this space and was particularly interested to see that the buy-write / covered call approach is now being applied to gold in the form of the recent launch of GLDI.

Part of what prompted today’s approach is the launch of U.S. Equity High Volatility Put Write Index ETF (HVPW), which is the first put-write ETP on the market. I have talked about put-write strategies and the CBOE S&P 500 PutWrite Index (PUT) at some length here in the past and have included some links below for additional reading.

In the convertible bond space, CWB has been the most popular ETP in this space for the last few years. Earlier this week, PowerShares closed its competing Convertible Securities Portfolio ETF (CVRT), essentially ceding this space to CWB for now.

The other portion of the graphic below is my attempt at translating much of yesterday’s text into a format that makes for a more handy reference.

I will keep tabs on all of these ETPs going forward and in particularly look to see how HVPW and GLDI do in terms of both risk-adjusted performance and investor acceptance. I certainly hope it does not take investors as long to discover these products as it did for them to warm up to the likes of ZIV.


Related posts:

Disclosure(s): long PBP at time of writing

Wednesday, March 21, 2012

The Dangers of Anticipating a Market Reversal

Raise your hand if you are anticipating a bearish reversal in stocks in the near future. Great. Lots of hands here... Now let’s be honest, how many were also expecting a reversal a week ago? a month ago? ever since the calendar turned to 2012?

Market reversals are notoriously difficult to predict, which is part of the reason why many successful investors stick exclusively to trend following strategies. If one bets on a market reversal such as a correction during a bull market and it doesn’t happen, not only is there a loss associated with a short position, but there is also the opportunity cost of not having participated in the rally.

The worst part of trying to anticipate a market reversal, however, can be the psychological damage. If an investor thinks that a market is overbought or overvalued, then gets short and covers that short after the market continues to rise, they often subsequently have to wrestle with a mental block that makes it even harder to get long in a market that now appears to be even more overbought/overvalued.

So what is a savvy investor to do when he or she believes that stocks have risen too far too fast?

One approach is a stock replacement strategy. This approach consists of selling existing long holdings and replacing these with equivalent long call positions (1 contract for every 100 shares held.) A stock replacement strategy allows an investor to participate in any subsequent bullish moves, yet limits losses to the cost of the options purchased. While all stocks and other securities do not have options associated with them, there are always index options and options on a wide range of exchange-traded products (ETPs) available that are close approximations for the original holding.

For investors who think stocks are more likely to tread water than correct sharply, covered calls (or buy-write strategies) are an appropriate strategic choice. Here there are ETPs which can execute such strategies, the most popular of which is the PowerShares S&P 500 BuyWrite Portfolio ETF (PBP).

A third approach might be to rotate into less volatile holdings such as the popular PowerShares S&P 500 Low Volatility Portfolio ETN (SPLV).

Investors who are looking to hedge their existing long equity positions without rotating into options, covered calls or low volatility holdings might want to review my recent Dynamic VIX ETPs as Long-Term Hedges, which focuses on VQT and XVZ.

Quite a few talented investors have missed out on the 2012 rally and despite what you hear on CNBC or read in your favorite financial publication, there is no guarantee we will get a big pullback anytime soon. In the meantime, there are a number of approaches that will allow investors to benefit from any continued bull moves, while minimizing downside risk. In addition to some of the approaches outlined above, the links below should be a good source of information for explaining some alternative approaches as well as the nature of the recent market moves.

Related posts:

Disclosure(s): long PBP and XVZ at time of writing

Tuesday, January 3, 2012

Covered Calls Finish Strong in 2011

Just looking back at The Year in VIX and Volatility (2011) is enough to make one’s stomach churn. Try to tell someone who has acrophobia that even the scariest roller coaster ride ends up right where it started and you will likely not assuage any fears. Something similar is at work for hikers, bikers or mountain climbers. The amount of effort they will need to call upon has nothing to do with ending up at the same elevation they started, but rather it is the cumulative elevation gain over the course of the trail, road or mountain. As with many things in life, it is all about the journey, not the destination.

For those who may have a touch of acrophobia, prefer their hikes to put less stress on their cardiovascular system and want a portfolio that matches the way they wish to experience the world, covered calls or buy-write strategies might be the answer. I have addressed the subject of covered calls and buy-writes a number of times in the past in this space (see links below), but essentially this is a strategy which sells calls against an existing (covered call) or new (buy-write) long position in order to generate income off of the underlying. Covered calls and buy-writes will generally beat the SPX/SPY if stocks decline, move sideways or rise slowly. The cost to implementing one of these strategies is that if the markets make a sharp bullish move, gains are capped by the covered calls.

In the ETP world, there are two choices when it comes to buy-write strategies:

  • PowerShares S&P 500 BuyWrite Portfolio ETF (PBP)
  • iPath CBOE S&P 500 BuyWrite Index ETN (BWV)

PBP is by far the more liquid of the two alternatives, but some investors may have a reason to prefer BWV’s approach and performance.

In the chart below, I have captured the equity curve of PBP vs. SPY over the course of the second half of 2011 – a period in which stocks generally moved sideways and volatility remained high. In other words, a period that was tailor-made for buy-write strategies. Note that PBP outperformed SPY by 7.7% during this six-month period, with considerably less volatility and also a less peak-to-trough drawdown…or what alpinists would probably call cumulative elevation loss.

Should high volatility persist in 2012 and stocks end up near where they started the year, both PBP and BWV are likely to outperform the major market indices once again.

Related posts:


[source(s): ETFreplay.com]


Disclosure(s): long PBP at time of writing; TradeKing is an advertiser on VIX and More

Thursday, August 12, 2010

Surfing for Weekly Buy-Write Trades

One half hour into today’s trading, I would expect to see some evidence that the recent spike in volatility in stocks is subsiding. That seems to be the case, as the VIX opened at 27.21 and is now just over 26.00.

Before volatility falls any farther, I will be looking at some possible or buy-write (covered call) trades with the new weekly options that are expiring tomorrow.

When I screen for buy-write candidates, I generally start with a screen for the highest implied volatility stocks, ETFs and indices, then qualify these on liquidity terms, examine the proximity of the current price relative to the various strike prices, then review the charts for some of the finalists and add some sort of secret sauce at the end to come up with trades that fit my objectives.

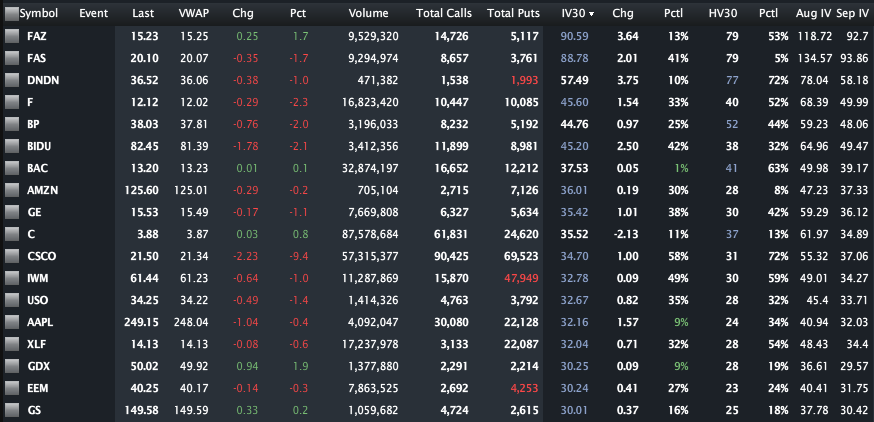
In the graphic below, I have included all of the weekly options in which the underlying has an implied volatility is at least 30. The list has 18 candidates and prominently atop that list is the triple ETF pair for the financial sector: FAS and FAZ. Going down the list, Ford (F) and Bank of America (BAC) show excellent liquidity, while Apple (AAPL) is hovering just under an important round number and strike.

Enterprising souls may even consider buy-writes on both FAS and FAZ.

Volatility is up and the end of the week is nearing. Anyone looking at a buy-write strategy should take a close look at earnings for today and tomorrow which may impact the market, as well as a number of economic reports due out tomorrow morning, most notably the July retail sales data.

For more on related subjects, readers are encouraged to check out:


[source: Livevol Pro]

Disclosure(s): short VIX at time of writing; Livevol is an advertiser on VIX and More

Wednesday, June 16, 2010

The Elusive Trading Range

During the course of the last year or two, stock market pundits have reminded me a little of politicians in the sense that I have seen a dramatic increase in both the polarization of ideas and the stridency of the tone in which various points of view are presented. To some extent, the two are related and the bifurcation is understandable. Strong macroeconomic winds are blowing and the range of possible outcomes now seemingly includes quite a few more extreme scenarios than it did just a few years ago. The move toward a more decentralized media has also probably reinforced this trend.

When it comes to politics, the decline of the moderate thinker can be at least partly explained by the nature of the institutions and political processes that tend to herd voters into opposing camps. In the investment world, the shrinking of the centrist philosophy is more difficult to understand. After all, if two equally extreme scenarios each have the same probabilities associated with them, then the mathematical expectation is zero and represents no change at all.

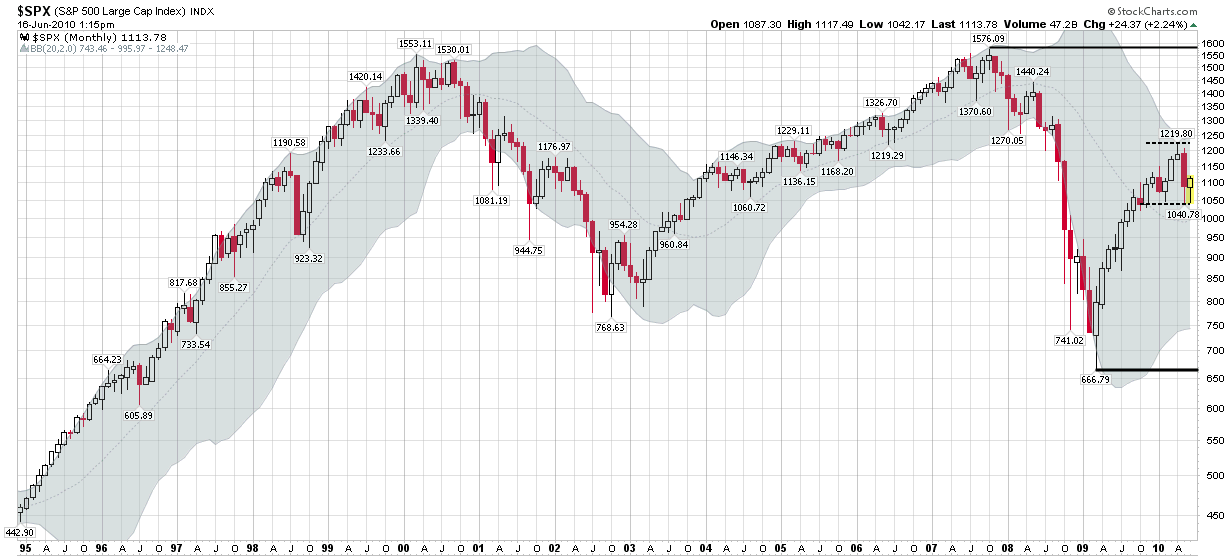
All of this leads me to the chart below, which utilizes monthly bars in the S&P 500 index. Five strong trends jump out in this chart:

  1. 1990s bull market, capped by the dotcom craze
  2. 2000-2002 technology-led bear market
  3. 2002-2007 rally, with easy money and the Greenspan put
  4. 2007-2009 bear market, with real estate and financials leading the way down
  5. 2009-2010 bouncing off the bottom

Based on the chart alone, investors can certainly be excused for being conditioned to expect stocks to trend strongly in one direction or the other. The truth is that we haven’t seen a good sideways market in a long time and investors just don’t expect a trading range to develop any more. The centrists have either slowly gone broke or have been banished to Extremia (just west of Siberia, if I recall correctly.)

Since nobody else is talking about a trading range, I thought I would stick my neck out and predict that SPX 666-1219 will likely define a trading range going forward, but perhaps more importantly, the tighter 1040-1219 range could also serve as a trading range for a surprisingly long period. Just because there are two large extremist camps doesn’t mean that both bulls and bears can’t be wrong.

If the markets do settle into a trading range, then options selling strategies are likely to perform well, particularly if high volatility persists. This means covered calls may soon be back in vogue, with more advanced traders looking at the likes of straddles, strangles, butterflies and condors.

For more on related subjects, readers are encouraged to check out:


[source: StockCharts.com]

Disclosure(s): none

Wednesday, May 26, 2010

Expiring Monthly May Issue Recap

Just a quick note to confirm that on Monday marked the publication of the May issue of Expiring Monthly: The Option Traders Journal.

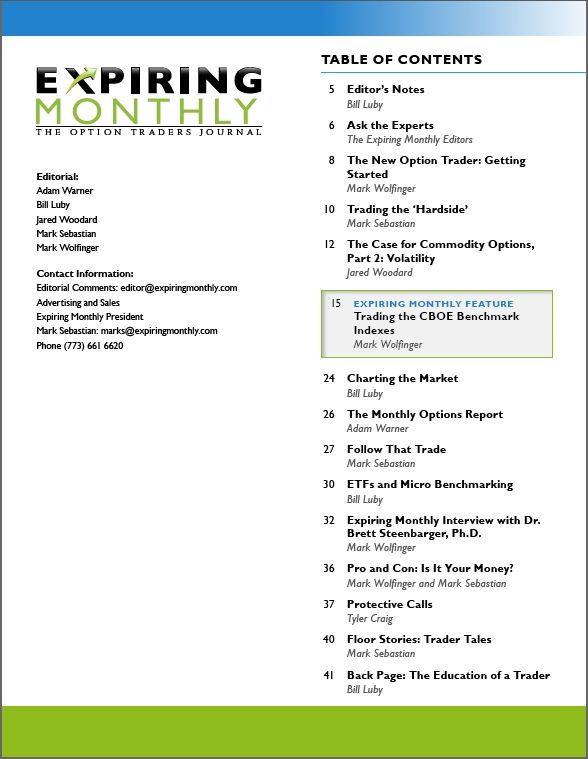
I have attached a copy of the Table of Contents for the May issue below. The cover story for this issue was written by Mark Wolfinger and focuses on the CBOE benchmark indices for buy-write (covered call) put-write and collar strategies. In my opinion, these three options strategies are attractive ways for investors who seek to outperform the broad-based indices in declining, sideways and slightly bullish markets – which is not a bad description of the market activity we have been seeing lately. In the case of collars, one can also have complete protection against market crashes and fund this approach entirely by selling calls.

For the current issue, I contributed a feature article on ETFs and micro benchmarking (the art of finding a very narrow slice of the investment universe as an appropriate gauge of portfolio performance) as well as my recurring column, Charting the Market, which makes heavy use of options data. In addition to the introductory Editor’s Note, I also penned the Back Page commentary, which puts my personal slant on the process of educating a trader.

Additional details about the magazine are available at http://www.expiringmonthly.com/.

Note that next week I will be inviting reader submissions for the Chart of the Week and will award an annual subscription to my favorite submission.

For more on related subjects, readers are encouraged to check out:


[source: Expiring Monthly]

Disclosure(s): I am one of the founders and owners of Expiring Monthly

Wednesday, January 6, 2010

Sideways Markets, Covered Calls and the RUT

I had originally thought that I might begin 2010 with a series of articles on covered calls and other ways of using options to generate additional returns during sideways market action. Since several other writers have already jumped on this subject (notably Jeff Opdyke of the Wall Street Journal in Covered Calls Prove Popular Strategy; Mark Wolfinger of Options for Rookies in Writing Covered Calls in 2010; and Adam Warner of Options Zone in When Is the Best Time to Use a Buy-Write?) I am going to start slowly with these pointers above and a handful of links to previous posts below.

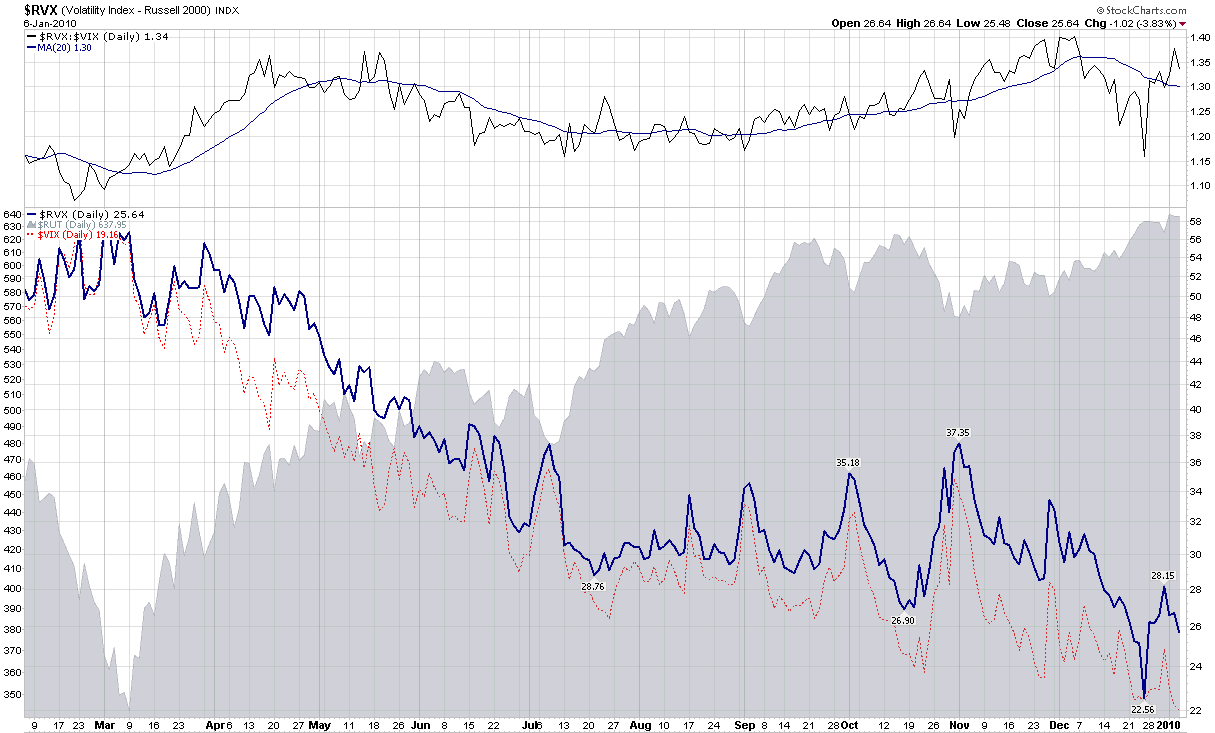
There is another point I wish to make. As of today’s close, the RVX, which is the volatility index for the Russell 2000 small cap index (RUT), is 33.8% higher than the VIX. As the chart below shows, this is at the high end of the range for the past year. Should volatility return to the markets, then I can certainly see how one might anticipate higher volatility in small caps than in the SPX. On the other hand, if stocks are going to continue to move sideways as they did today, then sellers of RUT options (straddles, strangles, iron condors, butterflies, etc.) should receive extra compensation for their short volatility positions.

For more on related subjects, readers are encouraged to check out:


[source: StockCharts]

Disclosure: none

Thursday, October 15, 2009

TradeKing’s Options Screening Tools

When TradeKing launched their stock and options brokerage back in December 2005, I was one of the first to sign on. The promise was an inexpensive commission structure, some innovative tools and an emphasis on integrating social media themes into the online experience. In the almost four years since it was launched, TradeKing still differentiates their services along the original three themes and has made increasingly larger overtures to options traders, including a strong educational component.

I have always had a good experience with TradeKing, but I realized today that my account was now growing some moss from extended neglect on my part. Frankly, there have been two relatively basic issues that have kept me at arm’s length over the past few years:

  1. The biggest issue I have is the three hour maximum login period before the website automatically logs me off. As an active trader, unless I can leave my browser window open for a full trading session without having to worry about being timed out just before I want to make an important trade, then I am going to be an intermittent customer at best.

  2. A related issue is the TradeKing login process, which is not keystroke-driven, but mouse-based. This is undoubtedly attractive for the security conscious trader, but not for those who wish to automate the login process and/or never be automatically logged off in the first place.
For the record, I have no problem with enhanced security features, but it would be nice if customers could elect the level of security that is appropriate for their account.

In any event, in surfing around TradeKing, I could not help but notice that there is a liberal sprinkling of iVolatility tools, notably the Volatility Charts; Options Calculator; Probability Calculator; Options Scanner; and Options Strategy Scanner.

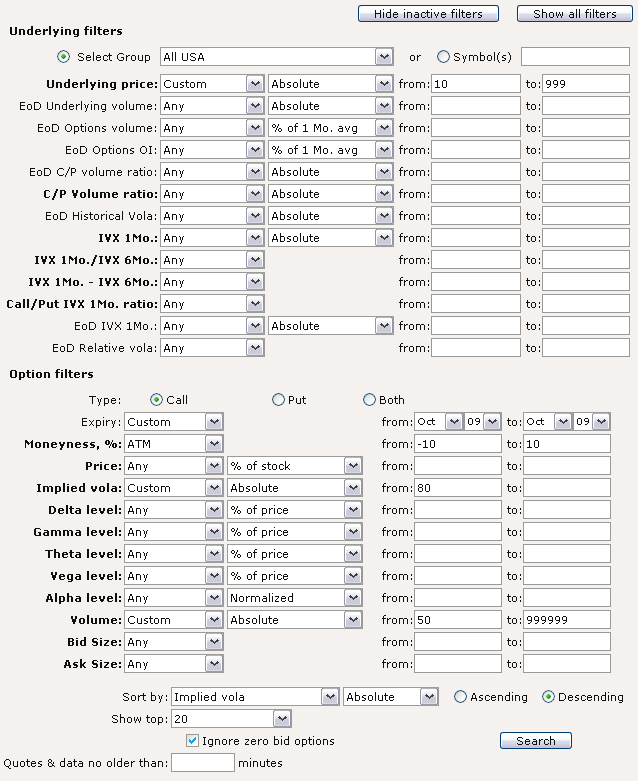
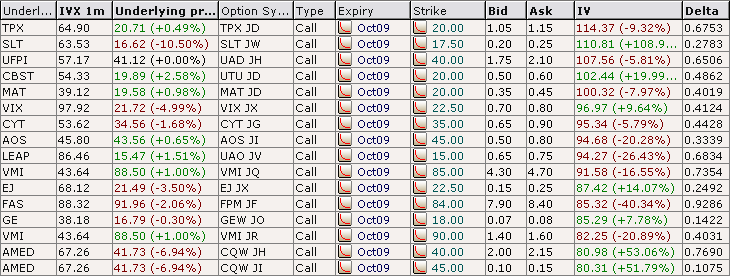
Tomorrow being the last trading day for equity options prior to expiration, I thought it might be interesting to use the TradeKing Advanced Options Scanner to give me some trading ideas. Specifically, I decided to look for one day buy-write (i.e., buy a stock and simultaneously sell a covered call) trades, using the scanner to identify near-the-money October calls with implied volatilities of 80 or more.

The top chart below shows the simple scan parameters I used and the bottom chart shows the results of that scan. Looking at out-of-the-money (OTM) calls, I see that Cubist Pharmaceuticals (CBST), which reported earnings after the bell, has October 20s for sale at 0.50, which represents a 2.51% return from today’s close. In fact, all the OTM calls on this list are from companies which reported after the market close today or are scheduled to report results tomorrow morning. Still, the Options Scanner runs in real time and may be able to identify a high potential buy-write opportunity after the open.

In sum, The TradeKing-iVolatility partnership makes some interesting tools available to TradeKing account holders. Going forward, I will be looking to incorporate more TradeKing tools and graphics into the blog.

[Edit: I note that one reader wondered whether this post was some sort of endorsement for TradeKing. On the contrary, my intent is to rotate through some of the main options brokers (thinkorswim, optionsXpress, OptionsHouse and TradeMonster) in order to highlight what I consider to be some of the better features, etc. and give people a feel for some of what is available from each of these brokers. That being said, TradeKing does advertise on the blog from time to time, but so also do all the other brokers listed above, save thinkorswim.]
For related posts on these subjects, readers are encouraged to check out:

[source: TradeKing]

Monday, September 8, 2008

The Value of Selling Covered Calls

One subject that gets less attention than it deserves is the value investors can extract from selling covered calls. To be fair, a covered call strategy sacrifices what can sometimes be considerable upside in exchange for a fixed return, but this can be a highly effective strategy in a range-bound market.

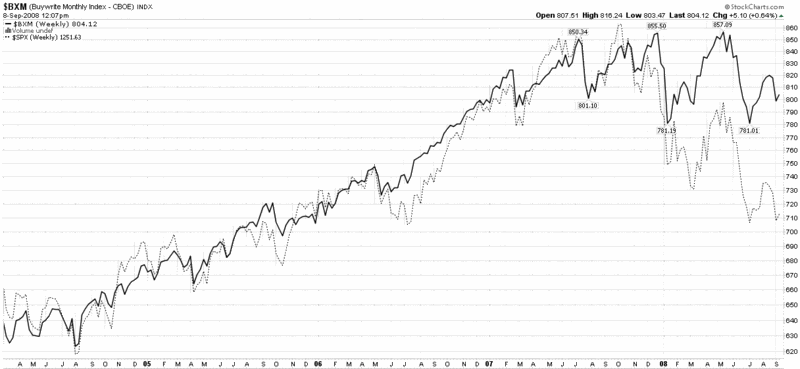
The chart below is a weekly chart that shows the CBOE S&P 500 Buy-Write Index (BXM), which is designed to replicate a buy-write or covered call strategy for the S&P 500 Index. Note that during the recent bull market, a buy-write strategy resulted in roughly the same returns as owing the SPX, but with less volatility.


[source: StockCharts]

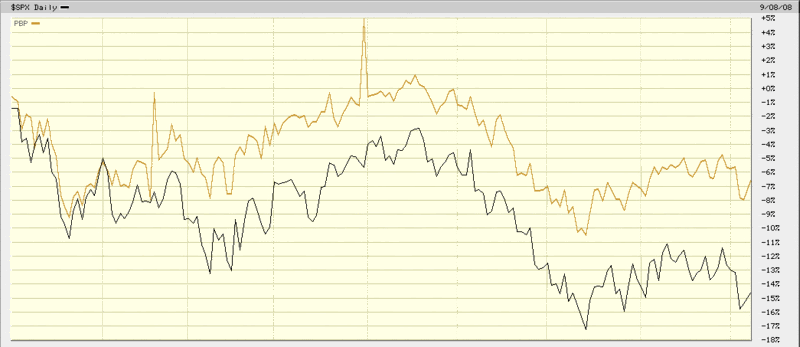
More importantly, over the course of the last year, a buy-write strategy has significantly outperformed the SPX. The details can be seen in the next chart, where a relatively new ETF, the PowerShares S&P 500 BuyWrite Portfolio (PBP) has lost value at less than half of the rate of the losses in the SPX.

In sideways markets, in down markets, and even in up markets, a buy-write or covered call approach like that of the PBP (or first cousins BEP and MCN) can be an excellent way to increase returns and reduce risk.


[source: BigCharts]

Thursday, March 20, 2008

BEP and the Joy of Covered Call Funds

I have spoken about buy-write or covered call funds on a number of occasions, perhaps most notably in One Approach for Volatile Sideways Markets.

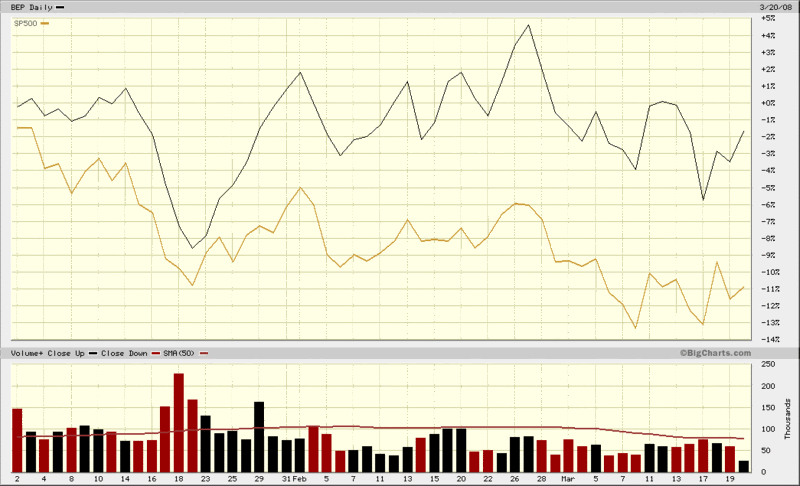
One of my favorite funds in the covered call space is the S&P 500 Covered Call Fund (BEP), a closed-end fund that is the most actively traded of the covered call funds. BEP is currently trading at a 4.9% discount to net asset value and is an excellent way to capture some of the volatility premium in the current market without having to go to the trouble of establishing your own covered call portfolio. Looking at the chart below, while the SPX is down approximately 11% year to date, by writing covered calls against the SPX, BEP has managed a loss of only about 1.5% since the beginning of the year. Covered call funds will almost always outperform the SPX in down and sideways markets, but will generally have less upside potential in a bull market.

For a more detailed profile of BEP, follow the link to the Closed-End Fund Association’s (CEFA) web site or get an annual report and other information directly from the BEP splash page at IQ Investment Advisors.

Monday, December 24, 2007

VIX Shrinkage Continues; VWSI at +6

During the week, I chronicled The Incredible Shrinking VIX, which addressed the issue of volatility falling in a market that was going mostly sideways to down. By the end of the week, the VIX was down 4.80 points or 20.6% from the previous week, to 18.47 – a level not seen since the beginning of November.

The interesting part of the week is that the SPX had a modest gain of 16.51 (1.1%), so that very little of the move in the VIX (perhaps 1.25 of those 4.80 points) can be attributed to a rise in the SPX. The rest? Some of it certainly comes from a seasonal pattern of historically low volatility around the holidays (see the CXO Advisory Group on U.S. Stock Returns Around the Year-End Holidays), but a considerable account is still unaccounted for. It looks like it may take the unfolding of events in 2008 to explain the shrinking VIX anomaly.

On the VWSI front, the shrinking VIX contributed to a new elevated VWSI reading of +6, suggesting that the VIX should be close to bottoming. Ironically, the VIX is up this morning, and so are the markets…

As is my weekly custom, for a survey of the best in current thinking about the markets, Barry Ritholtz at The Big Picture sums up the week that was and the week that will be in his Christmas Linkfest.

Finally, good news for those who are content to sit on the sidelines and wait for a more compelling market signal before committing to a specific direction, PowerShares is launching three new Buy-Write ETFs:

  • PowerShares DJIA BuyWrite Portfolio (PGB)
  • PowerShares S&P 500 BuyWrite Portfolio (PBP)
  • PowerShares NASDAQ-100 BuyWrite Portfolio (PWBW)
These join old standbys MCN, BEP and BWV in the buy-write stable.

(Note that in the above temperature gauge, the "bullish" and "bearish" labels apply to the VIX, not to the broader markets, which are usually negatively correlated with the VIX.)

Wine pairing: For a VWSI of +6 I favor a semillon. This often overlooked varietal tag teams with sauvignon blanc to form the white wines of Bordeaux, otherwise known as Graves. The thin skinned semillon grape is particularly susceptible to the Botrytis fungus, which means that semillon is also the primary grape used in the classic dessert wine known as Sauternes.

In the New World, semillon has gained a strong foothold in Australia, where it is frequently blended with chardonnay and sauvignon blanc, but also sold on its own. Last I checked, Peter Lehmann Wines produces four different semillons, with the Barossa Valley one of the most widely distributed in the US. Skipping a little to the east, just this evening I had an excellent 2002 Alpha Domus semillon from New Zealand, but the Kiwis have yet to show the same enthusiasm for semillon that they have for sauvignon blanc. Still, the Alpha Domus effort proves that the potential is there.

It is harder to pick a particular US producer that has built a reputation for semillon, but one to keep an eye on is L'Ecole Nº 41, from the Walla Walla, Washington area. This is, by a considerable margin, my favorite non-French semillion tasted in the past 25 years, a mineraly stunner that may have you rethinking how often you should be drinking this varietal.

For more information on semillon, StarChefs.com has a good discussion of the varietal, along with a handful of recommended producers in Australia and South Africa.

Tuesday, December 4, 2007

Thinking Sideways But Volatile? Consider MCN…

Until further notice, I am going to consider this a sideways market instead of trying to guess whether the next big move will be up or down.
In terms of trading implications, this means selling volatility in the form of bear spreads, iron condors, iron butterflies, short strangles, short straddles, selling an occasional naked call, and even that old standby, covered calls.

If you are not a regular options seller, many of these strategies can seem daunting, risky, expensive, and a lot of work. While this can be the case, there is an easy way: a covered call fund or ETF. I have prominently mentioned BEP here in the past. BEP, also known as the S&P 500 Covered Call Fund, is a closed-end fund that does exactly what the fund’s name says. I am increasingly becoming more of a fan of another closed-end fund that is very similar: the Madison/Claymore Covered Call and Equity Strategy Fund (MCN). This fund trades a little more actively than BEP, appears to be a little more flexible in its investment approach than BEP, and carries a current dividend yield of 11.5%.

In a sideways market where investors fear a lot of volatility, I’ll take 11.5% and a chance to participate in an up move any day…

Tuesday, October 23, 2007

Fibonacci Retracements and Trading Ranges

Most traders are reasonably knowledgeable about Fibonacci retracements, which predict the likely percentage retracement of any preceding up or down move. The details of Fibonacci retracements are discussed in many places on the web, so I won’t repeat them here other than to note that the most commonly used Fibonacci numbers are the retracement percentages of 38.2%, 50%, and 61.8%. When markets move sharply in one direction, then turn around, the first question traders tend to ask themselves is how long the move will last. The usual suspects are previous closes, moving averages and “Fibs.”

Even if you don’t believe in what some consider to be the equivalent of numerical astrology, the important thing is that other traders do and right or wrong, they can make Fibs a self-fulfilling prophecy.

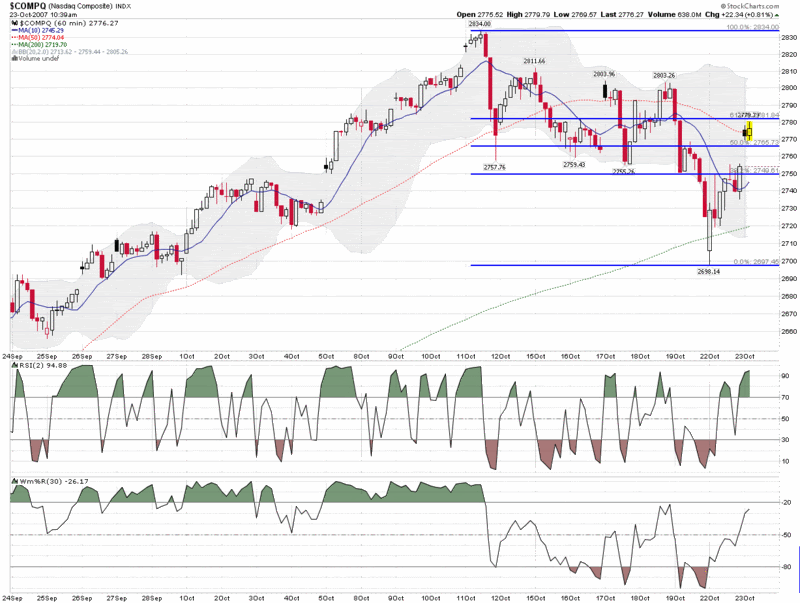
Part of the reason I mention all of this is that the NASDAQ composite just retraced about 61.8% of the recent drop and now is finding resistance at the Fibonacci level. The chart below tells much of this story, but the pressing question is what happens next. There is a temptation to assume that the bulls will eventually win out once again or that this time it looks like the bears finally have the numbers…but there is a third possibility, that we may be entering into a trading range. Once again, it is way too early to determine whether this may be the case, but today’s stalemate (so far) opens up that possibility. IF we are going to be in a trading range for awhile, expect Fibonacci levels to play an important role in defining the trading range, along with the other usual suspects.

Also, keep in mind that if we are in a trading range and volatility expectations continue to be on the high side, a covered call (or buy-write) fund, like market leader BEP, is an excellent low risk way to beat the market.

Thursday, July 26, 2007

One Approach for Volatile Sideways Markets

About two months ago, I talked about three different buy-write products (two closed-end funds and an exchange-traded note or ETN) which are designed to mimic a strategy of writing covered calls, such as is tracked by the CBOE S&P 500 Buy-Write Index (BXM.)

I was being a little cheeky when I suggested that this index might be useful as a market timing tool. Instead, I figured that the best application of a buy-write strategy would likely be as a cash equivalent of sorts, particularly for those who were looking for a place to park their money somewhere that it could earn a reasonable return in a volatile sideways market, yet participate in any unexpected upward moves.

I think we may be in just that market environment right now.

If you are worried about the RUT falling through its 200 day SMA today and most of the other major indices penetrating their 50 day SMAs, then perhaps you should take a long look at the BEP, MCN and BWV. I am slightly partial to the BWV, because, as an ETN, it will not have (taxable) distributions. There has been very little volume in BWV in the two months it has traded, but with a typical bid-ask spread of 0.10, it is competitive with the more liquid BEP and MCN at least on a small scale.

Wednesday, May 30, 2007

BuyWrite Index as a Timing Tool?

Adam at Daily Options Report has recently been talking about the CBOE S&P 500 BuyWrite Index (BXM) and related products in considerable detail – enough for me to finally take a look at it myself. Between the information on the CBOE site linked above, Adam’s comments and the insights of ETF-friendly blogger ‘Random’ Roger Nusbaum, you can find out just about anything you might wish to know about the BXM and products that utilized covered call strategies. Well, almost anything.

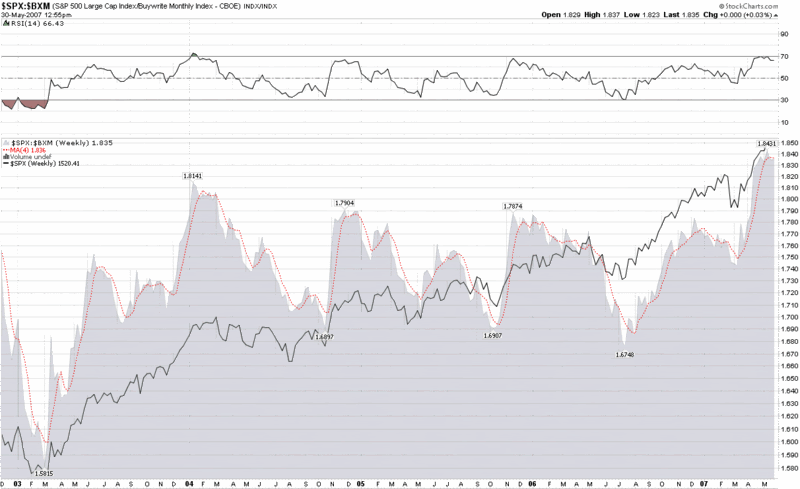
I got to wondering whether or not the BXM might be useful as a timing tool. After spending a little time at StockCharts.com, I put together several ratio charts that compare the SPX to the BXM. In a weekly ratio chart, appended below, I noted that for the last several years when the SPX to BXM ratio approaches 1.80 (or generally makes any 6-12 month high) and rolls over, this has usually provided some advance warning of a significant correction in the SPX over the next two to three months. What particularly caught my attention in the current chart is very high 1.836 moving average reading that appears to be just beginning to roll over.

This ratio is something worth watching; and the BXM and related products (BEP, MCN, and the newly minted ETN, BWV) are another way to think about harvesting volatility in what could be turning into a toppy market.

DISCLAIMER: "VIX®" is a trademark of Chicago Board Options Exchange, Incorporated. Chicago Board Options Exchange, Incorporated is not affiliated with this website or this website's owner's or operators. CBOE assumes no responsibility for the accuracy or completeness or any other aspect of any content posted on this website by its operator or any third party. All content on this site is provided for informational and entertainment purposes only and is not intended as advice to buy or sell any securities. Stocks are difficult to trade; options are even harder. When it comes to VIX derivatives, don't fall into the trap of thinking that just because you can ride a horse, you can ride an alligator. Please do your own homework and accept full responsibility for any investment decisions you make. No content on this site can be used for commercial purposes without the prior written permission of the author. Copyright © 2007-2023 Bill Luby. All rights reserved.
 
Web Analytics