Graphical Comparison of Performance of PutWrite and BuyWrite Indices
I was pleased to see the strong response generated by Friday’s The Often Overlooked Put Writing Strategy, particularly in some of the comments at Seeking Alpha, where the post was republished. A number of questions came up regarding the reasons why two strategies that are synthetically equivalent (i.e. share the same profit and loss graph), would have different performance characteristics. I cited the main reason for the performance delta as the skew that results from a tendency to price puts higher than calls, particularly during times of extreme market stress, when demand for puts often exceeds the demand for calls.
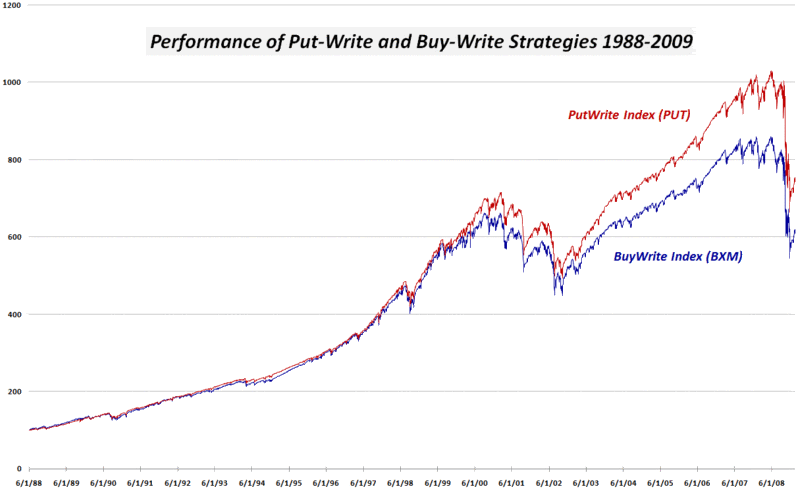
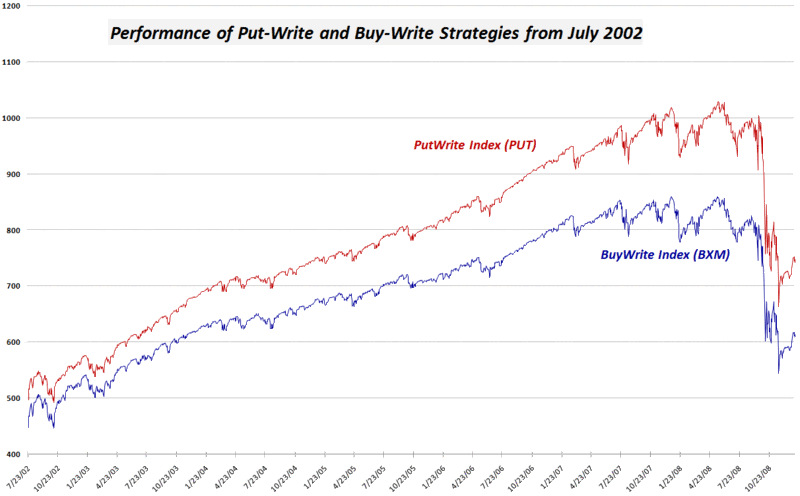
I am not sure that I can prove beyond a reasonable doubt the skew hypothesis in this space, but I did assemble two performance graphs that might help to inform any further discussion. Using the CBOE PutWrite Index (PUT) and the CBOE BuyWrite Index (BXM) as my source data, I have plotted the two indices from their 1988 inception (above) and from 2002 (below), when the indices begin to substantially diverge.
From the two graphs, I find it interesting that the put-write strategy begins to generate separation from the buy-write strategy during the 2002-07 bull market. As volatility increases during 2007, the put-write strategy continues to widen the gap, with the recent bear market having very little impact on the performance differential between the strategies.
Those who have any thoughts on the reasons behind the performance differential during different market cycles, please feel free to chime in.


[source: CBOE, VIX and More]


7 comments:
Thanks for pointing this out. I have been debating the merits of each PutWrite vs BuyWrite, especially coming out of this bear market.
Are there any ETFs that track this PUT index?
Hi Eric,
No ETFs that I am aware of. One commenter mentioned ETJ (Eaton Vance Risk-Managed Diversified Equity Income Fund) previously, but the only data I found showed put writing as only 0.3% of the portfolio.
Cheers,
-Bill
F E A R is ALWAYS GREATER than GREED !!!
Bill,
Just asking: Are you certain that the buy-write data includes all dividends?
Mark
Good question about the dividends, Mark.
From the CBOE paper on the BXM methodology (revised 6/30/08): "Dividends paid on the component stocks underlying the S&P 500 Index and the dollar value of option premium deemed received from the sold call options are functionally 're-invested' in the covered S&P 500 Index portfolio."
The BXM had a higher return than the PUT in 7 of the first 15 years. Whatever is driving better performance in the PUT seems to have picked up in 2003, as the PUT has outperformed the BXM in every year from 2003 to the present.
Cheers,
-Bill
There was an ETN that was to be launched by the CBOE that was based on the Put Write index (PUT). They were looking to launch last spring but it never listed yet. The symbol was to be XPT. I have not heard anything about it in a while however.
It isn't clear from the graph that the put-write strategy is outperforming the entire time. It looks like it gets to a higher point and then compounds the difference for a few years. This would be clearer on a log-graph, or if you plot the returns instead of the values.
jkw
Post a Comment