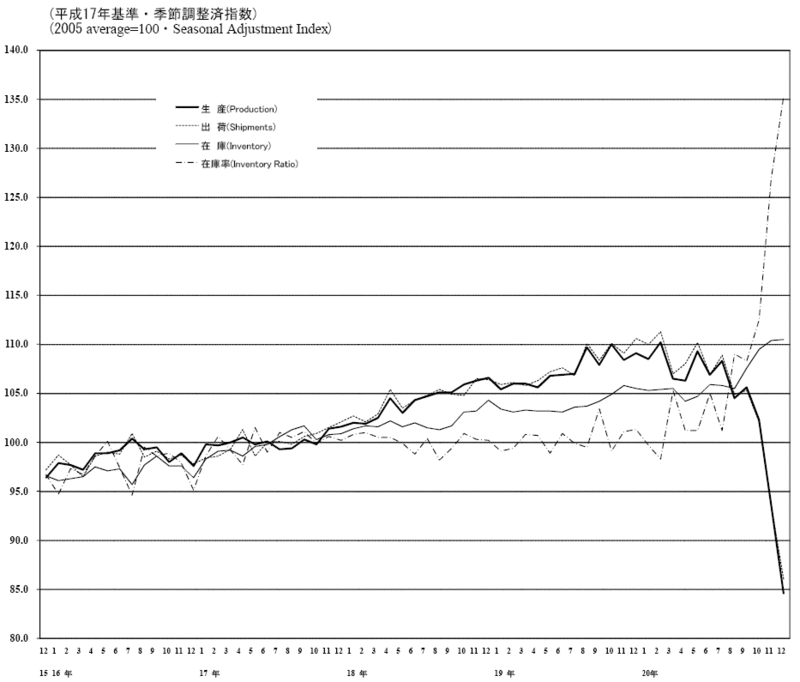
Chart of the Week: Industrial Production in Japan
With all the hoopla over a 3.8% drop in Q4 GDP in the United States and a 2.0% decline in industrial production reported two weeks ago, this seems like a good time to remind my largely Americentric audience that things are much worse overseas, particularly in Asia.
During the week Japan reported that December industrial production fell 9.6% and South Korea reported a December decline of 18.6%. These are staggering numbers, whether one chooses to compare them to U.S. data or to historical data sets.
In this week’s chart of the week, I have elected to compare Japanese industrial production data from December 2003 to December 2008, partly because I like the look of the Japanese characters and partly because it illustrates just how dramatically Japan’s export economy declined during the last three months of 2008.
Rapidly declining industrial production may well be Asia’s next major export to the U.S.

[source: Ministry of Economy, Trade and Industry - Japan]


0 comments:
Post a Comment