Chart of the Week: Volatility Drifts Lower
While stocks gave back some gains this week and any sense of inevitability was stricken from the consciousness of the bulls, volatility only grudgingly began to reappear on the charts.
In fact, if you look at the chart of the week below, you see more concern about future volatility in the form of the VIX than there are indications of rising current volatility, as reflected in the average true range (ATR) of the S&P 500 index. I elected to use the 21 day setting for the ATR, as it is based on trading days and approximates the 30 calendar day time horizon used by the VIX. For the record, shortening the ATR window to 10 days shows the same pattern of declining volatility. The SPX historical volatility picture is similarly calm, with 20 day historical volatility hovering around 31 at the moment.
Even with the markets selling off this week, volatility remains relatively low, at least as measured by post-Lehman standards.
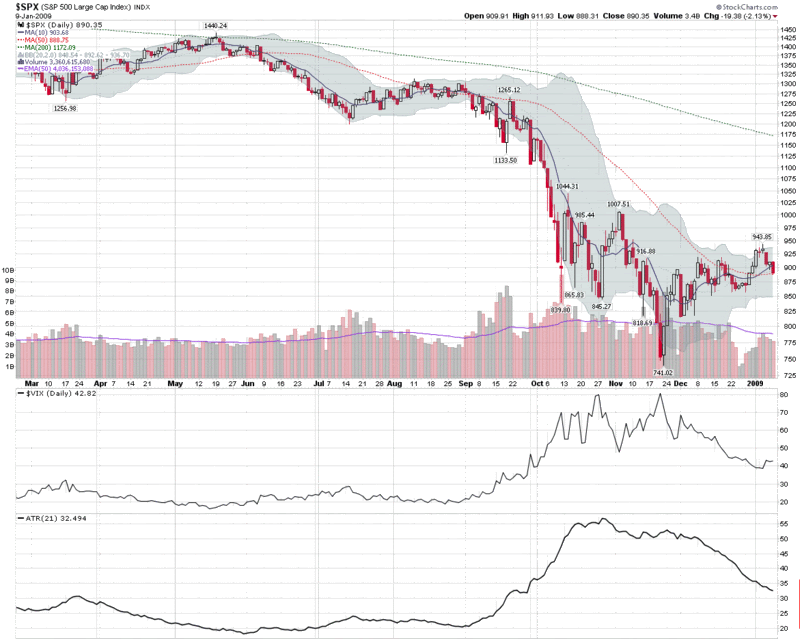
[source: StockCharts]


6 comments:
There was another VIX/SPX non-confirmation Friday with the VIX staying red almost the entire day with a couple of short-lived trips into the green while at the same time the SPX was very red.
I searched your archives but can't remember the title on the article where you discussed this in the past.
If I remember correctly from the information in that article, there is a better than 50% chance that the market will go opposite the VIX/SPX non-confirmation, which in this case would mean going up.
Of course, the market has either been in limbo or down for most of this past week so maybe it's ready to go up for a day or two regardless.
Interested in your comments on this.
Nirvanic
Bill,
I've only become aware of your blog site today and will soon read through your past posts. However, I noticed that your 21-day ATR of 31.494 varies significantly from the 29.55 for 21-day historic volatility for SPY I currently show using my Schwab StreetSmart Pro software. Could you please direct me to a good source so that I can better understand the differences between ATR and HV? And your explanation of why you prefer ATR to HV would be of interest as well.
Thanks,
Jeff
P.S. Oh! I just keyed in $SPX and the HV(21) there is 31.43 -- so I guess I need to figure out the difference between SPY and $SPX as well.
Hi Nirvanic,
I don't remember the exact post you referenced, but I suspect it is related to the Performance Implications of SPX and VIX Divergences post.
If you are a newsletter subscriber, you may recall that I went into much more detail about the numbers in the newsletter.
The other thing to recall is that because of the weekend effect (5 day trading week and 7 day calendar week), volatility tends to drop on Fridays and rise on Mondays.
Cheers,
-Bill
Jeff,
Your question gets at a post that I have been meaning to address for months, but got sidetracked and set aside when VIX started spiking.
The issue of HV vs. ATR essentially boils down to the fact that historical volatility looks only at close to close changes in the underlying, while ATR captures the full intra-day range, as well as overnight gaps.
For example, a stock that closed at 100 one day, opened at 120 the next day and traded down to 80, then closed back at 100 would be considered not volatile (for that one day at least) in historical volatility terms, but extremely volatile in terms of average true range.
I'll try to start a series of posts on the different ways to measure volatility in the coming week.
Cheers,
-Bill
P.S. Nice job with the blog and the Yahoo groups.
Thanks Bill. That's it.
Noticed that $BDI had a positive DMI cross. I'm not sure this is a real positive or just evidence that $BDI is finished going south.
I also read that ESEA renegotiated some of its contracts. This may be more from the drop in the price of fuel than reduced demand. Not sure. They dropped their daily rate from around $40,000.00 to around $20,000.00.
No question that DRYS and ESEA, and probably others in the group, have been on a tear lately. May just be a reaction to extreme oversold conditions on these.
Nirvanic
Speaking of Lehman and VIX, Richard Lehman has a lovely channel chart of VIX at his good and simple list at StockCharts.com:
http://screencast.com/t/rk78EgwNrN
http://stockcharts.com/def/servlet/Favorites.CServlet?obj=ID1399335
Post a Comment