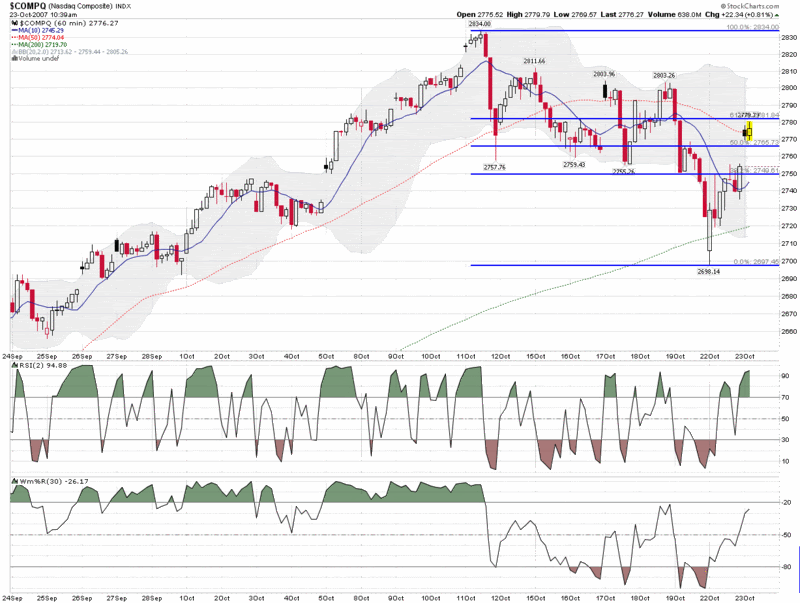
Fibonacci Retracements and Trading Ranges
Most traders are reasonably knowledgeable about Fibonacci retracements, which predict the likely percentage retracement of any preceding up or down move. The details of Fibonacci retracements are discussed in many places on the web, so I won’t repeat them here other than to note that the most commonly used Fibonacci numbers are the retracement percentages of 38.2%, 50%, and 61.8%. When markets move sharply in one direction, then turn around, the first question traders tend to ask themselves is how long the move will last. The usual suspects are previous closes, moving averages and “Fibs.”
Even if you don’t believe in what some consider to be the equivalent of numerical astrology, the important thing is that other traders do and right or wrong, they can make Fibs a self-fulfilling prophecy.
Part of the reason I mention all of this is that the NASDAQ composite just retraced about 61.8% of the recent drop and now is finding resistance at the Fibonacci level. The chart below tells much of this story, but the pressing question is what happens next. There is a temptation to assume that the bulls will eventually win out once again or that this time it looks like the bears finally have the numbers…but there is a third possibility, that we may be entering into a trading range. Once again, it is way too early to determine whether this may be the case, but today’s stalemate (so far) opens up that possibility. IF we are going to be in a trading range for awhile, expect Fibonacci levels to play an important role in defining the trading range, along with the other usual suspects.
Also, keep in mind that if we are in a trading range and volatility expectations continue to be on the high side, a covered call (or buy-write) fund, like market leader BEP, is an excellent low risk way to beat the market.


3 comments:
Hi :
Thanks for dropping by my blog.
Would visit your blog more often to learn more about VIX, which I'm amazed you have lots of info about it here.
Do you trade using VIX as a contrarian indicator?
Yours Truly,
Tony Chai
My Options Trading Blog
Hi Tony,
I just discovered your blog yesterday, but I was impressed with the content. Nice work!
Regarding my use of the VIX, I generally use it is a contrarian indicator and sometimes also trade VIX options based on various mean-reversion expectations I have (this is a large part of what the VWSI is all about.) The more time I spend with the VIX, the more confidence I have in using it for market timing.
Cheers,
-Bill
Hi Tony, I just discovered your blog yesterday, but I was impressed with the content. Nice work! Regarding my use of the VIX, I generally use it is a contrarian indicator and sometimes also trade VIX options based on various mean-reversion expectations I have (this is a large part of what the VWSI is all about.) The more time I spend with the VIX, the more confidence I have in using it for market timing. Cheers, -Bill
Post a Comment