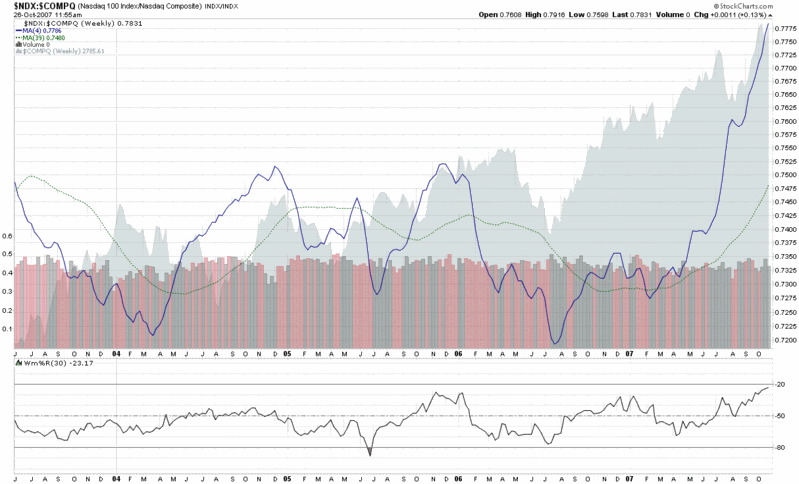
NASDAQ 100 Taking NASDAQ Composite for a Ride
This is probably just stating the obvious, but in keeping with the recent theme of a handful of generals and market breadth analysis, I thought I should highlight a comment from yesterday by Ben Bittlrolff who points to a recent observation by Mike Shedlock that half of the gains in the NASDAQ so far this year are from only three stocks: AAPL, RIMM, and GOOG.
Expanding a little on that thought, I have constructed a weekly chart of the ratio of the NASDAQ-100 (NDX) to the NASDAQ Composite. For visual simplicity, I have eliminated the weekly values and included only the four week and 39 week simple moving averages. The storyline is fairly straightforward: ever since the February 27th selloff, the NASDAQ-100 [listing of the components of the NASDAQ-100] has been pulling the broader composite along for the ride. Scroll back to Mike Shedlock’s comments about the big three horses and it appears that these three en fuego large caps have been pulling both the NASDAQ-100 and the 3000+ stock composite index.
As I see it, one of two things is about to happen: either some other fresh horses are about to appear to help pull the sled or AAPL, RIMM and GOOG are going to run out of energy trying to get up one of these upcoming hills. Be sure to watch the ratio of the NASDAQ-100 to the NASDAQ composite for some clues on how this story is developing.


1 comments:
The way I see it, if half of the gains in the NASDAQ so far this year are from only three stocks, then … there is a 97-stock index that has double-digit gains YTD, excluding those three stocks.
Is this something to complain about? A 97-stock index that gains double-digits?
A quick scan of the Nasdaq 100 shows that 44 of the 100 are up double-digits over the last 200 trading days. 54 of the 100 are up 5% or more. 63 are up for the year, period.
Is that a "lack of breadth" to anyone? If so, please respond with what levels of gains and numbers of stocks you'd consider appropriate breadth.
Post a Comment