SPX-VIX Daily Correlation
Yesterday I offered up some numbers to help describe the relationship between daily moves in the SPX and the VIX. I hear quite a few observers comment along the lines of “the SPX was up(down) X% and yet the VIX was only down(up) Y%.” Typically, the next action is to wonder aloud whether the corresponding VIX movement is ‘normal’ and whether any divergences might provide clues about the future direction of the markets.
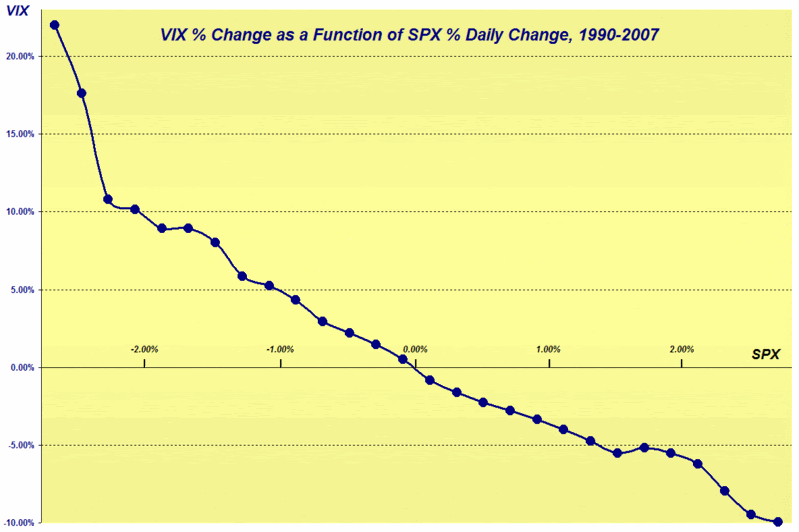
Naturally, I’ll take the easy part of that equation first and offer the reader two ways to look at this. The graph below plots daily percentage changes in the VIX against daily percentage changes in the SPX. From the graphic, you can see that the relationship between the two is fairly linear for a SPX moving +/- 1.5% in a day. Once the SPX moves outside of those bounds, however, the equations get a little messier. Part of this, of course, is the accelerating fear factor that comes with extreme market moves.

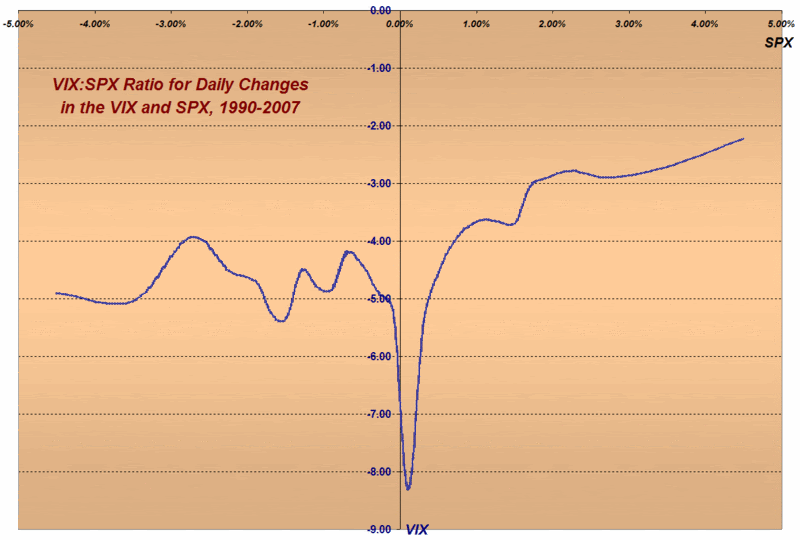
The next graph ignores the absolute numbers and focuses on the magnitude of the typical VIX movement versus the SPX movement. Readers are encouraged to ignore the valley around the zero (where strange things happen when you try to divide by zero) and focus instead on the fairly predictable ratio of the VIX to SPX that varies from about -2.5x to about -5.0x, depending upon the daily change in the SPX.

As for the remaining question about whether divergences from the normal relationship provide reliable clues about the future direction of the market, I am going to address this more difficult question over the course of the lifetime of this blog. I will offer this though: if I think I can simplify the answer in one concise post, I will do the best I can to communicate my thinking here.


5 comments:
Did you do anything funky with your data or simply take the closing VIX prices and divide them by your closing SPX prices for your VIX:SPX ratio? Or is it the ln of the daily returns or a 9 day EMA?
Hopefully not too funky :)
These are closing prices (no SMAs/EMAs/etc.) and simple division, with averages for SPX buckets at various intervals. The one aspect of the graph that is not entirely true to the data distribution is the tails, where the SPX is >2% or <-2%. In these tails, the size of the buckets was expanded, meaning that the top chart understates the increasing steepness of the curve outside of the (proportional buckets) range from +2% to -2%.
I hope this helps.
-Bill
What do you mean by 'buckets'? This is a rolling interval?
By 'buckets' I mean groups of data pairs within a specific SPX interval. For example, all the data where the SPX daily change % is:
Bucket A) 0.00 <= SPX < 0.20
Bucket B) 0.20 <= SPX < 0.40
Bucket C) 0.40 <= SPX < 0.60
...
This helps to smooth the data, among other things.
I'm gone to inform my little brother, that he should also pay a visit this website on regular basis to obtain updated from latest reports.
Feel free to surf my web site diets that work fast for women
Post a Comment