Showing posts with label VQT. Show all posts

Sunday, December 6, 2015

The Current VIX ETP Landscape

I have been writing about VIX ETPs since the launch of the initial duo of VXX and VXZ back in January 2009 and from 2010 onward I have been plotting all of them on a leverage/maturity grid like the one below. It is amazing how often various VIX ETP investors mentioned one of these charts when I talk to them. Even through the VIX ETP space has been relatively stable as of late, I have not updated this graphic since early 2014, so a refresh is long overdue.

For those who have not been following along over the years, I have plotted every VIX-based ETP using leverage on the Y-axis and maturity on the X-axis. With the advent of what I am calling VIX strategy ETPs, I have isolated in their own box in the lower right hand corner a half dozen of these products whose characteristics do not necessarily imply a fixed point on Cartesian coordinate system.

The key at the bottom highlights various salient features of each of these products. From previous incarnations, I have retained the presence of non-VIX legs (typically positions in SPX/SPY), the combination of both long and short legs, dynamic allocation of the legs and optionability. I have also shaded areas where there is high leverage/compounding risk as well as high roll yield risk. Not surprisingly, these risks converge at TVIX and UVXY, two of the more infamous VIX ETPs.  Another carryover is font color, where black indicates ETFs and blue is for ETNs.  This time around I have also added yellow stars for those ETPs with an average daily volume of 1,000,000 or higher and pink stars for ETPs with an average daily volume between 100,000 and 1,000,000. Note that while CVOL technically makes the cut, at today’s closing price of 0.40, any sort of meaningful reverse split to raise the price about 5 or 10 would highlight just how illiquid this issue is. In fact, only six VIX ETPs pass the one million share screen: TVIX, UVXY, VIXY, VXX, SVXY and XIV.

VIX ETPs 120615

[source(s): VIX and More]

There are three new additions to this graphic. The most notable of these are VXUP and VXDN, which were launched by AccuShares back in May. These products deserve a post (or series of posts) dedicated to some of the issues surrounding them, but the short version is that high complexity, frequent distributions and consistent tracking errors resulted in a product that investors decided was not worth their trouble. The other “new” products is, VQTS, the first ETP that tracks the SPX VEQTOR Switch Index, making it a relative of VQT and PHDG, but one which uses a dynamic allocation to VIX futures to achieve a 10% target realized (historical) volatility. VQTS was launched in December 2014 and like most VIX ETPs, has struggled to reach critical mass.

While the VIX ETP market is showing some signs of maturing, there are many new and exciting developments in terms of low volatility ETPs and more broadly in the ETP space in general. As I am currently at the IMN 20th Annual Global Indexing & ETF Conference – and scheduled to speak on a panel, “Trading the VIX: Riding Today's Waves of Volatility” with Larry McDonald, Mark Shore and Matt Moran tomorrow – this seems like a good time to devote more time to writing and in particular to resurrecting the “and More” portion of this blog.

Related posts (a selection from literally hundreds of posts on VIX ETPs):

Disclosure(s): net short VIX, VXX, UVXY and TVIX; net long SVXY, XIV and ZIV at time of writing

Wednesday, October 23, 2013

Performance of VIX ETPs During the Recent Debt Ceiling Crisis

Since the first big wave of VIX ETPs hit in 2010, I have periodically plotted all these products on a grid that used the y-axis for leverage and the x-axis for target maturity. While the initial intent was to highlight roll yield risk and leverage/compounding risk, over time I was unable to resist the urge to indicate which ETPs were optionable, which had both long and short legs, which had legs that were dynamically allocated, which had non-VIX components, etc. In other words, I fell victim to my unceasing need to try to tell an entire story on one slide, no doubt due in part to having seen too many 80-page presentations put together by consulting teams…

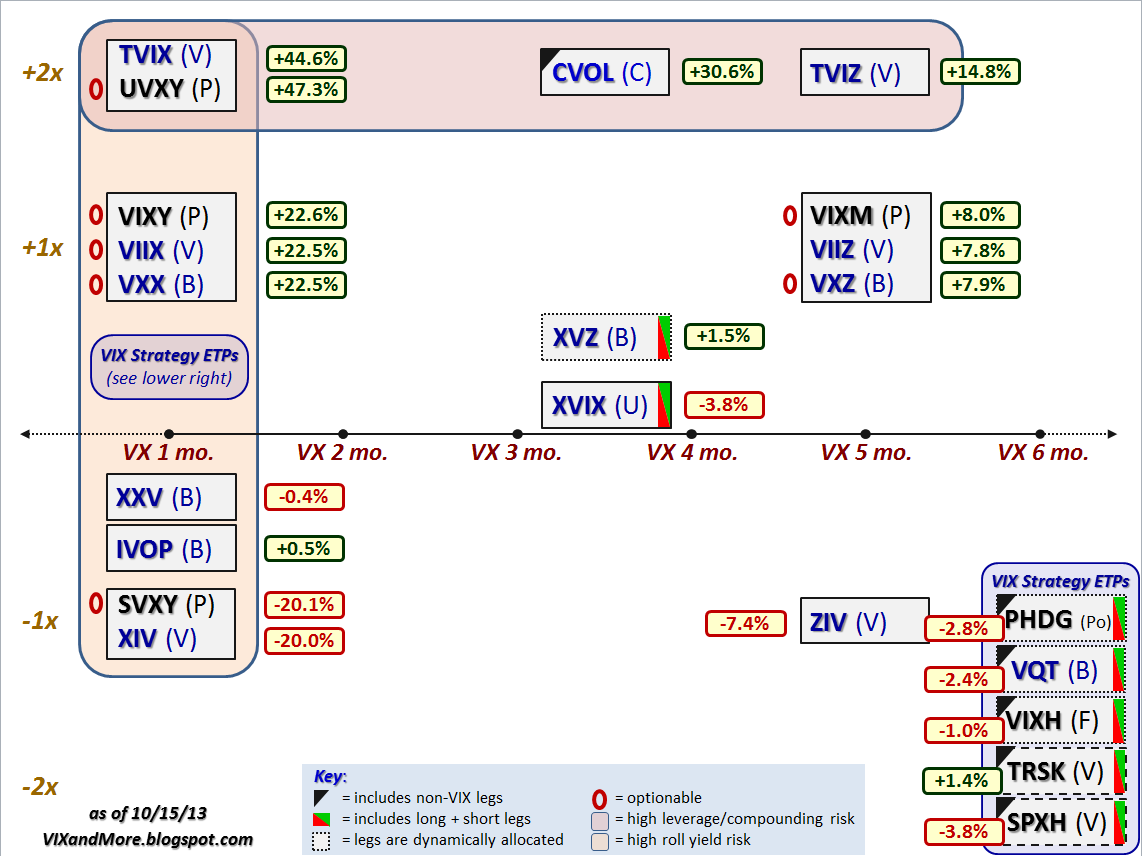
That being said, today’s iteration of my graphical depiction (“field guide”) of the VIX ETP universe is somewhat of a compromise. This compromise is due in part to the proliferation of VIX ETPs that combine long and short legs and have those legs dynamically allocated. The first of these to launch (back on August 31, 2010) was the Barclays ETN+ S&P VEQTOR ETN (VQT), which was followed by the First Trust CBOE S&P 500 Tail Hedge Fund ETF (VIXH) on August 29, 2012 and later by the PowerShares S&P 500Downside Hedged Portfolio (PHDG) on December 6, 2012. The field became considerably more crowded this year when VelocityShares launched the Tail Risk Hedged Large Cap ETF (TRSK) and the Volatility Hedged Large Cap ETF (SPXH) on June 24, 2013.

Rather than cramming these five similar products into the same narrow space, I have separated them from the grid and given them their own “VIX Strategy ETPs” box. With VIXH and PHDG now having a reasonable body of historical data to analyze, I have had a fair amount to say about these products already and will have more to say about them in the near future. TRSK and SPXH present an entirely different approach to hedging with volatility products and I will devote a separate post to these in short order.

In the meantime, the graphic below shows the performance of all the VIX and volatility ETPs from September 20 (when the VIX closed at 13.12) to October 8 (when the VIX closed at 20.34), when the VIX spiked 55% increase in just 12 trading days. As the graphic shows, for the most part the higher the leverage and the shorter the duration, the better the VIX ETP performed during the crisis. The performance of the VIX strategy ETPs was a mixed bag, with only TRSK posting a gain during this period. Another perennial hedging favorite, XVZ, also posted a gain.

[source(s): CBOE, Yahoo, VIX and More]

The trick with these hedges is one of timing.  As has been noted here on many instances in the past, the top performers in a crisis are typically those which are ravaged by price decay due to roll yield and/or compounding when the VIX does not spike. Compare the winners and losers in the graphic below with the winners and losers tallied in VIX ETP Performance in 2012 to gets a sense of how expensive it can be to carry speculative long volatility positions as well as more dynamic hedging positions over the course of an extended period. The bottom line is that it is almost impossible to create a VIX ETP that will perform well when the VIX spikes and when there is below average volatility or expectations of future volatility.

This is not to say that it is impossible to time long and short volatility positions in order to be positioned to take advantage of increases and decreases in volatility, only that most buy-and-hold scenarios have a negative long-term expectation and timing the volatility market is probably more difficult than timing the equities market.

The bottom line is that if you think Democrats and Republicans might have some difficulty navigating the January 15 deadline for funding the government or the February 7 deadline for raising the debt ceiling once again, then look no farther than the graphic above for some ideas about how to trade these events.

Related posts:

Disclosure(s): none

Wednesday, August 14, 2013

Expanded Performance of Volatility-Hedged and Related ETPs

When I recently assembled Top Posts of 2013 (Through First Half of Year), several themes jumped off the page. The top four posts of the year summarize what many investors have been worrying about this year:

  1. The Low Volatility Story in Pictures
  2. Four Years of SPX Pullbacks in One Plot
  3. VIX ETP Performance in 2012
  4. All-Time VIX Spike #11 (and a treasure trove of VIX spike data)

The issues are related to pullbacks in stocks, the VIX spikes associated with them, how to minimize portfolio volatility when these types of events happen and what the implications are for various VIX exchange-traded products.

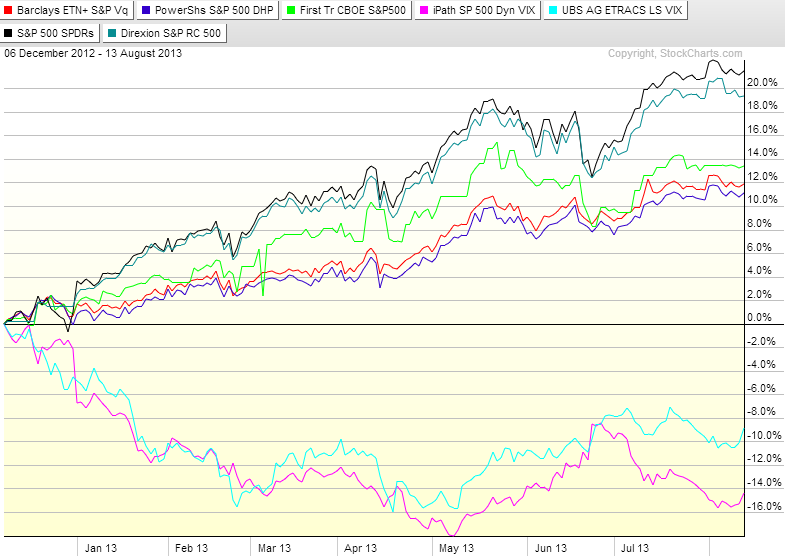
With that backdrop and a stock market that has been looking fatigued while it has meandered sideways for the past month, quite a few investors are thinking about how to hedge a portfolio that has a long-equity bias. In the graphic below, I capture the recent performance of a number of ETPs which may be suitable for hedging that type of portfolio.

[source(s): StockCharts.com]

Interestingly, the performance of these securities appears to fall into three distinct groups.

The top group has two ETPs:

  • SPY (black line), included largely for reference purposes
  • Direxion S&P 500 RC Volatility Response Shares (VSPY), which employs a market timing mechanism that dynamically allocates between stocks and bonds according to measures of market volatility (blue-green line)

The second group contains the core of the VIX-based dynamic hedging products:

  • First Trust CBOE S&P 500 Tail Hedge Fund ETF (VIXH), which is essentially a portfolio consisting of 99-100% of SPY, augmented by a dynamic allocation of 0-1% of VIX options (light green line)
  • Barclays ETN+ S&P VEQTOR ETN (VQT), which has a dynamic allocation of VIX futures that fluctuates based on realized volatility and the trend in implied volatility (red line)
  • PowerShares S&P 500Downside Hedged Portfolio (PHDG), like VQT, has a dynamic allocation of VIX futures and is based on the S&P 500 Dynamic VEQTOR Index (dark purple line)

The bottom group includes two performers:

  • UBS ETRACS Daily Long-Short VIX ETN (XVIX), which is equivalent to a fixed allocation of a 100% long position in VXZ, offset by a 50% short position in VXX. I have included XVIX (aqua blue line) here largely to show how closely the performance corresponds to that of XVZ
  • iPath S&P 500 Dynamic VIX ETN (XVZ), utilizes the slope of the VIX:VXV ratio (SPX 30-day implied volatility to SPX 93-day implied volatility) to determine the dynamic allocation to short-term and medium-term VIX futures. In this case, the allocation to short-term VIX futures (think VXX) can be either long or short, while the allocation to medium-term VIX futures will always be long, though it is variable (fuchsia line)

Keep in mind that the most aggressive hedges are almost always the ones that underperform the most in bullish periods. If you want a very different look at how some of these products perform when stocks decline sharply, check out Performance of VIX ETP Hedges in Current Selloff.

The links below provide some background information on some of these products as well as performance data and should serve as excellent starting points for more comprehensive research.

Related posts:

Disclosure(s): long VQT and short VXX at time of writing

Thursday, November 8, 2012

Performance of VIX ETPs During Current Pullback

Of all the issues discussed in this space, undoubtedly the one that captures the imagination of most readers is the subject of VIX-based exchange-traded products. I get more questions about the construction of these products, how they respond to the VIX futures term structure, what factors influence performance, etc.

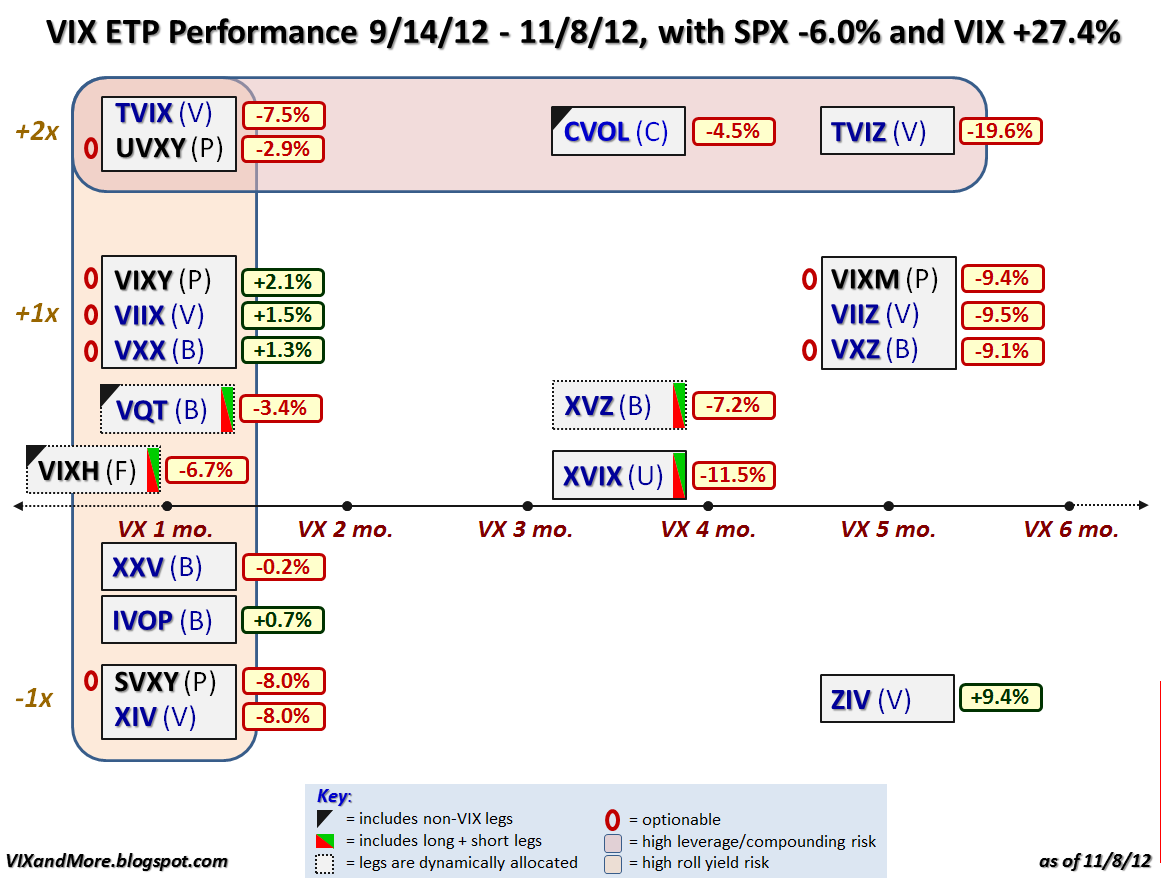
For these reasons I thought it might be instructive to update my VIX ETP landscape chart and include performance data from the September 14th market closing high of SPX 1465 to today’s close of SPX 1377. During that period, the SPX declined 6.0% on a close-to-close basis, while the VIX jumped 27.4% during the same period.

So how did the VIX ETPs fare while the market was selling off?

In examining the graphic below, the first thing you probably notice is that only 5 of the 19 VIX ETPs were able to manage gains during the selloff. In fact the average (mean) VIX ETP performance was a disappointing -4.9%, while the median return was -6.7%. Even more interesting, the inverse volatility products actually outperformed their long volatility counterparts and had the top performer of all, the VelocityShares Daily Inverse VIX Medium-Term ETN (ZIV).

In addition to the static allocation long and short volatility ETPs, there are also three products that use rules-based formulas to dynamically allocate the amount and type of long volatility exposure: VQT, XVZ and VIXH. None of these three products was able to produce a profit during the selloff and the top performer among the group, VQT, managed a loss of 3.4%.

I previously superimposed performance data on this same VIX landscape graphic back on April 3rd in VIX ETP Returns for Q1 2012, following a 12.0% gain in the SPX during that quarter and a 33.8% drop in the VIX. Note that only two VIX ETPs managed to post gains during the bullish first quarter and the selloff of the past eight weeks: ZIV and IVOP. If anyone wonders why I never bother to mention IVOP, first off it has only traded on three days during the past month and second, it has a participation of only 0.13, which means essentially that the portfolio moves as if only 13% of the assets were invested in the underlying index and the balance remained in cash.  As for ZIV, I have been all over this one, including a feature post, ZIV Undeservedly Neglected, back in January.

Now that VIXH has been added to the mix of VIX ETPs, I will endeavor to provide performance updates on some or all of the VIX ETP product space on a more frequent basis going forward.

In the meantime, for those who are in search of reasons why some of the VIX ETPs outperform their peers in various market regimes, the links below are an excellent place to begin your research.

Related posts:

[source(s): Yahoo]

Disclosure(s): long ZIV and XVZ at time of writing

Friday, June 15, 2012

Performance of Volatility-Hedged ETPs

An emerging area of interest in the markets in general and in this space in particular is the subject of how to blend volatility exposure – both long and short – into a portfolio.

Based upon feedback I have received, three recent articles that have touched upon this subject from different angles have all resonated with readers:

Clearly the role of volatility in a portfolio is a subject that warrants further analysis and discussion.

It is worth noting that issuers of exchange-traded products have taken several approaches to addressing volatility. The most obvious was the launch of VIX-based ETPs, such as the popular VXX (iPath S&P 500 VIX Short-Term Futures ETN,) which is a long basket of short-term VIX futures.

Subsequent products have tackled the subject of volatility in a variety of different ways, including:

  1. Utilize low beta stocks to minimize portfolio volatility (SPLV)
  2. Employ a market timing mechanism that dynamically allocates between stocks and bonds according to measures of market volatility (VSPY)
  3. Employ a market timing mechanism that dynamically allocates between stocks and VIX futures according to measures of market volatility (VQT)
  4. Employ a market timing mechanism that dynamically allocates between long and short volatility positions (XVZ)

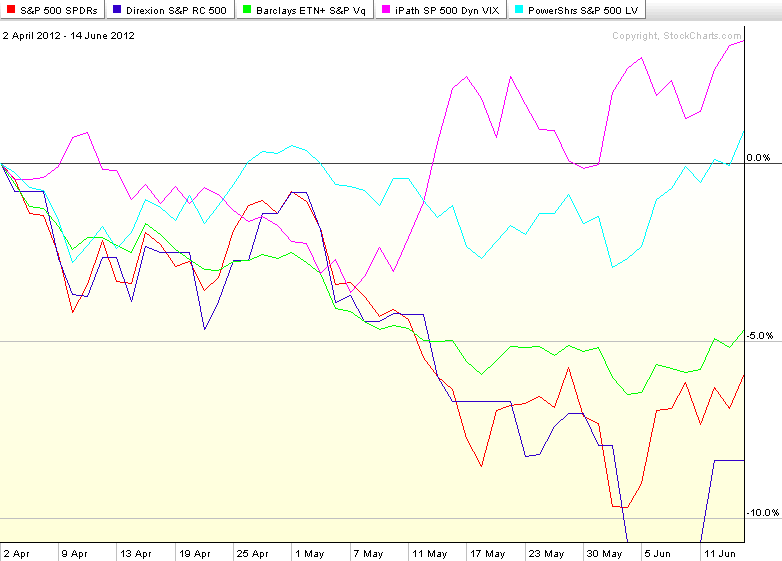
With the S&P 500 index down about 6.3% through yesterday’s close from its April 2nd high, it is reasonable to ask how these approaches have been performing during this bearish phase. The chart below shows the performance of SPY in red. Two of the approaches employed have had a performance trajectory that is almost indistinguishable from that of SPY: VQT (green line); and VSPY (dark blue line), which is thinly traded.

The two standouts during the past 2 ½ months are SPLV (light blue line) and XVZ (purple line). You can see from the graphic that SPLV has done exactly was it is supposed to do: minimize volatility. For the better part of the period in question, SPLV has been largely unchanged. Lately it has risen largely due to its substantial exposure to utilities and consumer staples. The other standout is XVZ, which essentially uses the slope of VIX futures term structure to determine how it allocates between long and short volatility positions. With the VIX futures in contango (front months less expensive than more distant months) since last November, this product has been able to capitalize on negative roll yield, while also providing protection against a spike in the VIX.

While this data should be of interest to traders who are looking for volatility-based hedges or even speculative applications going forward, today is definitely a case where past performance should not serve as a guideline for what to expect in the next week or two.

For those who are looking for more powerful VIX hedges, long positions in VIX calls and VXX calls (including the weeklys) will provide the most robust long volatility hedges. For those who are looking to minimize portfolio volatility going forward, the four approaches outlined above (as well as the links below) should warrant further investigation.

Related posts:

[source(s): StockCharts.com]

Disclosure(s): long XVZ and short VXX at time of writing

Tuesday, April 10, 2012

Performance of VIX ETP Hedges in Current Selloff

It was only a week ago that I discussed the performance of 31 VIX and volatility-based exchange-traded products in VIX ETP Returns for Q1 2012 and barely a month ago that I examined in some detail the workings of two VIX ETPs, VQT and XVZ, in Dynamic VIX ETPs as Long-Term Hedges. When stocks fall and volatility rises, however, which VIX ETP hedges work the best?

The answer is not so simple, unless you know when volatility will begin to spike, how far it will go and how long it will take to get there. Even then, it would still be helpful to know what happens to the VIX futures term structure along the way.  Also, there are liquidity constraints that will probably limit the choices for most investors to a half dozen or fewer alternatives.

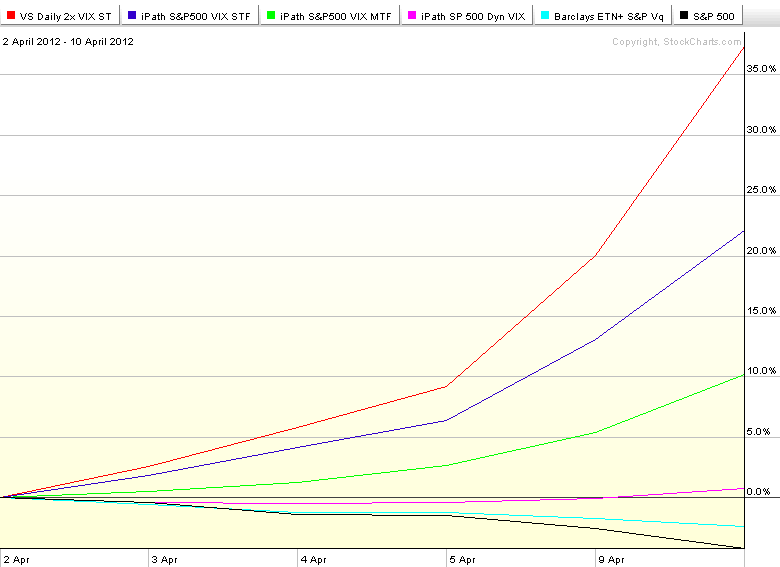
That being said, the current selloff can be used to highlight some important heuristics and alternative approaches. The first graphic below, for instance, illustrates the performance since the April 2 close of five representative and relatively liquid VIX ETPs (TVIZ was excluded on the grounds of liquidity; its performance during the period was similar to that of VXX) that can be used as hedges. For the most part, the performance trend is the opposite of what was observed during the first quarter.

The three fixed allocation VIX ETPs have been excellent performers during the last five trading days. With +2x leverage and a short-term (weighted average of one month) maturity, TVIX (red line) was the standout in the group. The second best performer during the selloff was VXX (blue line), a +1x short-term product.  The +1x mid-term (weighted average of one month) maturity VXZ (green line) ETP has also been a strong performer, certainly worthy of a bronze medal. All three hedges have gained more than 10% during the last five trading days, while the S&P 500 index (black line) has fallen 4.3%. In sharp contrast to their fixed allocation brethren, the two dynamic allocation VIX ETPs have both hovered around the unchanged line during the selloff, with XVZ (fuchsia line) eking out a small gain after a small bounce today, while VQT (aqua blue line) has posted a loss during the same period.

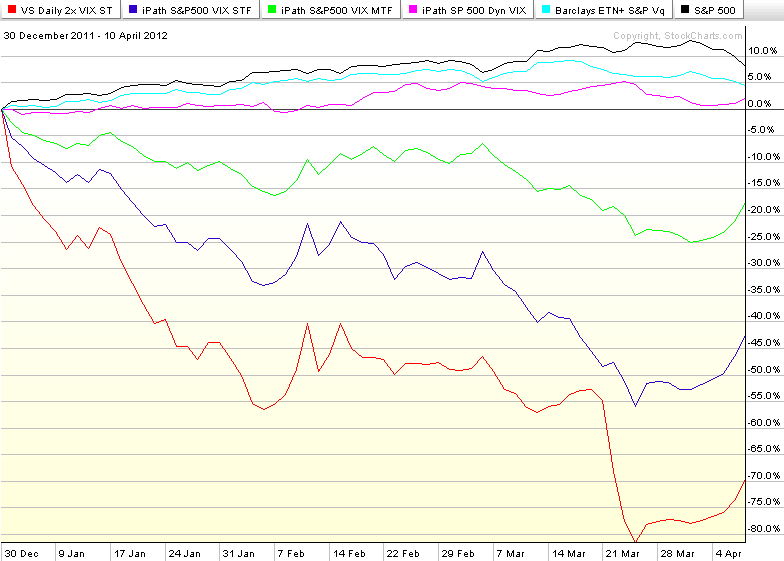
Obviously, anyone who bought TVIX (or VXX or VXZ) on April 2 is sitting on a nice profit, but the second graphic, which tracks performance of the same ETPs since the beginning of the year, lays out the big picture conundrum succinctly. In short, the most responsive hedges (TVIX, VXX, etc.) are those which have a fixed allocation and are most susceptible to losses due to contango and negative roll yield while one is waiting for a hoped-for VIX spike to materialize. The dynamic allocation VIX ETPs, on the other hand, are tweaked to minimize losses due to contango and negative roll yield and thus can be left in place for extended periods, but there is enough lag time built into their dynamic allocation rules so that they offer little protection from sudden and short-lived VIX spikes, while doing a better job of protecting portfolios during extended periods of volatility, such as the peak of European sovereign debt crisis during August-September 2011.

So…if you know when the fireworks are going to start, TVIX and VXX are excellent choices as volatility hedges for long equity portfolios. If the timetable is uncertain (which is often the case) and the goal is to protect against a period of extended high volatility, then VXZ and VQT are likely to be more compelling alternatives.

Related posts:

[source(s): StockCharts.com]

Disclosure(s): long XVZ; short VIX, VXX and TVIX at time of writing

Tuesday, April 3, 2012

VIX ETP Returns for Q1 2012

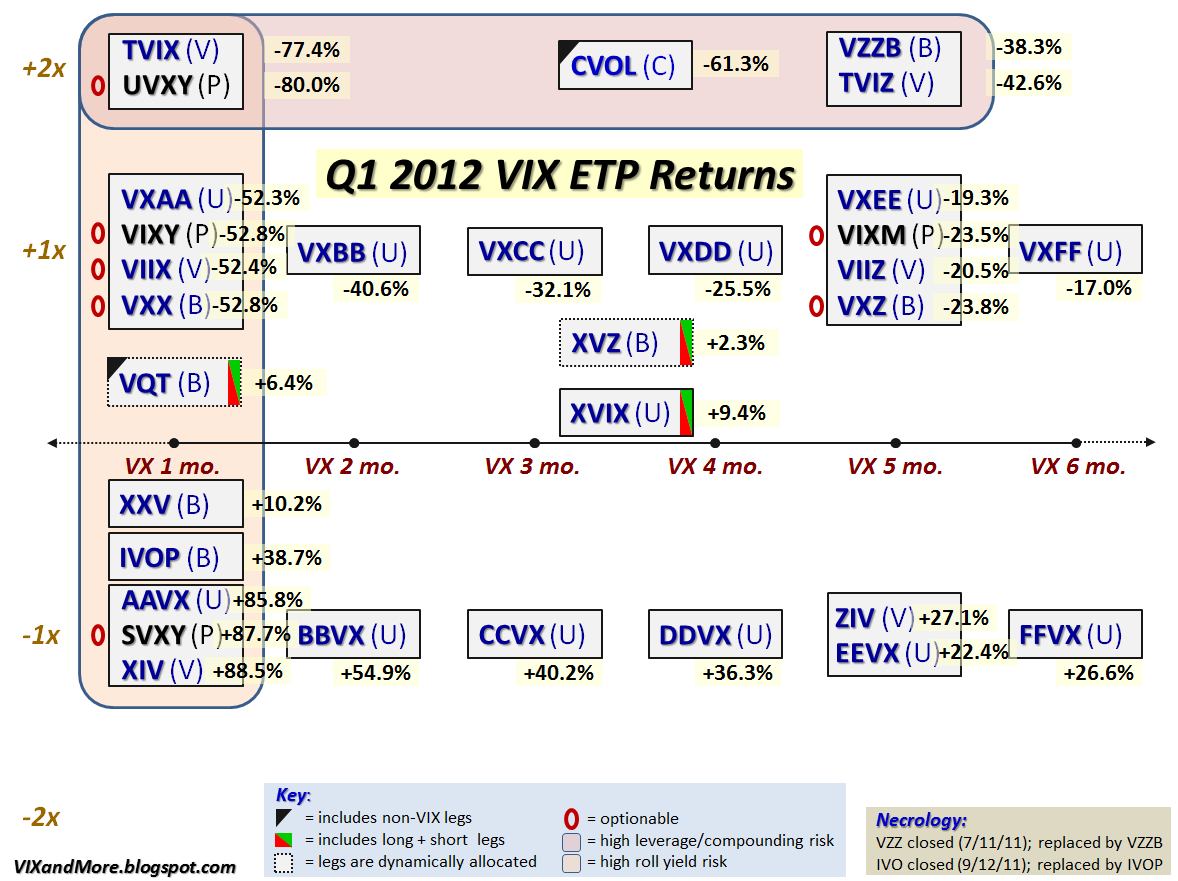
Back in my consulting days, I convinced myself that there were rare instances when an ugly chart crammed full of data should take precedence over a clean and simple graphic that focused on the key takeaways. For my purposes at least, the graphic below, while unlikely to garner accolades from the likes of Information Aesthetics of Flowing Data, is one of those instances and suits my purposes perfectly. [After all, this blog is really just a place for me to archive my own idiosyncratic ideas and the two million interlopers are just a curious side effect, but I digress…]

Getting back to the main point, the graphic below updates the VIX exchange-traded products (ETP) landscape (the only additions are two new red 0s to indicate that UVXY and SVXY are now optionable) and adds performance data for the first quarter of 2012.

Of course anyone who has checked in on this space periodically certainly has already realized that the first quarter saw record contango and negative roll yield across the full spectrum of the VIX futures term structure. As a result of this, the long volatility products had a horrendous three months, the inverse ETPs racked up huge gains and those products with dynamic allocations (VQT and XVZ) or offsetting long and short volatility legs (XVIX) were able to manage small(er) gains.

Following the usual pattern, the products with the shortest target maturities were the most volatile, while those with longer target maturities saw much less movement.

Also notice the symmetry of the return structure. For all the long products that were getting whacked (TVIX, UVXY, VXX, TVIZ, etc.) there were corresponding inverse products (XIV, SVXY, ZIV, etc.) that were racking up larger gains than the losses suffered by their long volatility counterparts.

Last but not least, perhaps the distribution of the returns will help to explain why I have organized my previous VIX ETP ‘field guides’ in this fashion.

This graphic should implicitly raise a bunch of issues and the links below are good jumping off points for further exploration regarding a number of those issues.

For the time being I will leave additional analysis to those in the comments section.

Related posts:

Disclosure(s): long XIV, ZIV, BBVX and XVZ; short TVIX, UXY and VXX at time of writing

Friday, March 2, 2012

Dynamic VIX ETPs as Long-Term Hedges

With the huge contango in the VIX futures term structure at the moment, anyone who is buying VIX options or the VIX exchange-traded products (ETPs) right now is having to pay for that contango in order to have the opportunity to capitalize on increasing volatility. With the contango-based negative roll yield currently running at 15% per month, this means the cost of a volatility hedge for long equity positions is extremely expensive in the current market.

Fortunately, investors do have some alternatives that have a different type of appeal.

There are two VIX ETPs, VQT and XVZ, which attempt to minimize the impact of the negative roll yield by using a market timing mechanism that dynamically adjusts the long volatility exposure. In more volatile markets, the exposure increases; in less volatile markets, the long volatility exposure is either very low (in the case of VQT) or can even flip to a small net short position (in the case of XVZ).

VQT is more of a portfolio replacement strategy, while XVZ is more of a portfolio augmentation strategy. Specifically, VQT has long SPY exposure that ranges from 60% to 97.5% of its portfolio, with the balance (2.5% - 40%) allocated to a long position in the VIX short-term futures (think VXX). The links below will provide more details.

XVZ, on the other hand, does not hold any long equity component, only short-term (again, think VXX) and mid-term (think VXZ) VIX futures. The twist here is that while the mid-term VIX futures component can range from 50-100% of the portfolio, the short-term component can be as high as 50%, but as low as negative 30%. So…under certain circumstances (e.g., a very steep VIX futures term structure, like the one we are currently experiencing), the portfolio will consist of the equivalent of a 30% short position in VXX and a 70% long position in VXZ. On balance, that type of portfolio should be very close to volatility neutral and in some cases even have a slight short volatility bias.

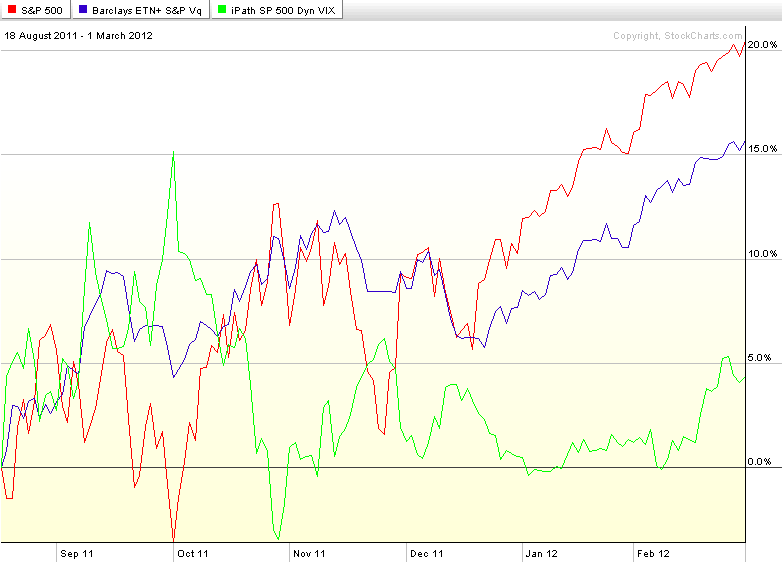
Since XVZ was only launched on August 18, 2011 (VQT dates back to September 2010), I have chosen a graphic that shows the relative performance of the SPX (red line), VQT (blue line) and XVZ (green line) from the launch of XVZ to the present. Note that with its long exposure, VQT is better able to take advantage of a low volatility slow bull market. XVZ, on the other hand, is generally close to flat in a low volatility bull market, but should the VIX spike sharply higher, XVZ will likely do a better job of capitalizing on the volatility spike.

As investors ponder the fatigued bulls and inevitable pullback sometime in the near future, certainly VQT and XVZ warrant a more detailed investigation, along with some of the non-volatility ETPs that are meant to reduce risk and hedge against a downturn, such as VSPY, SPLV, and others.

Related posts:

[source(s): StockCharts.com]

Disclosure(s): long XVZ and short VXX at time of writing

Tuesday, February 21, 2012

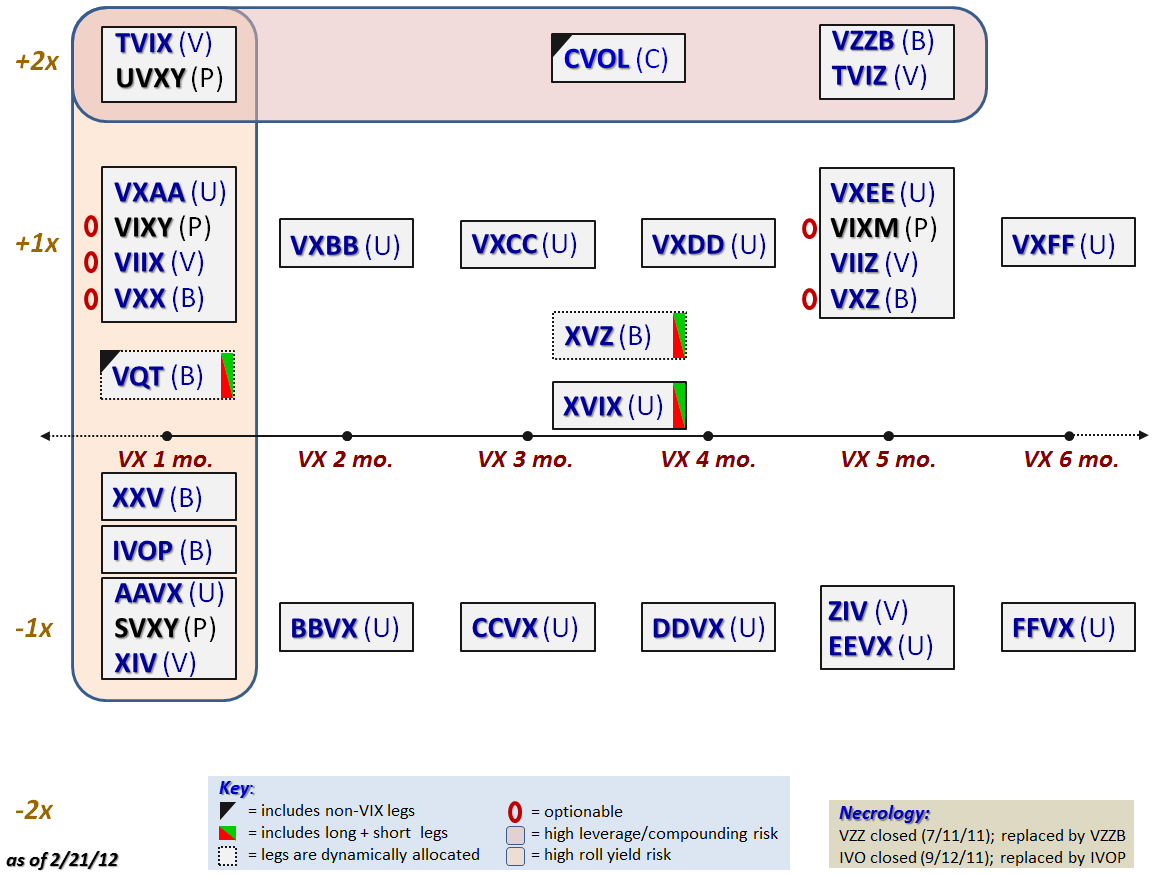
An Updated Field Guide to VIX ETPs

With the sudden success of TVIX, it seems as if the entire VIX exchange-traded product (ETP) space has a large number of new converts. Growing from just two products at the end of 2009 (VXX and VXZ) to 12 by the end of 2010 and 31 by the end of 2011, VIX ETPs are a growth industry.

For those who trade or invest in the VIX ETP space, I thought the graphic below – a field guide of sorts – might be of assistance. The intent of the graphic is to differentiate between the various VIX and volatility-based ETPs primarily by mapping them according to target duration and leverage. The key at the bottom of the graphic highlights some additional distinctions, such as:

  • ETPs that hold some non-VIX securities in their portfolio are marked by a black triangle. These include VQT and CVOL, which hold long or short positions in SPX/SPY
  • ETPs that include both long and short VIX positions in their portfolio (VQT, XVZ and XVIX) are flagged with a red/green rectangle
  • ETPs with a dotted outline (VQT and XVZ) have a rule-based dynamic allocation of volatility components
  • the red ovals highlight those five VIX ETPs that are currently optionable
  • the large light red shaded area incorporates all the ETPs that use 2x leverage (there are no 3x VIX ETPs)
  • the large orange shaded area incorporates all the ETPs which have a target average weighted one month duration and thus are particularly susceptible to the influence of contango and negative roll yield in the VIX futures portion of their holdings

There are some other important distinctions that are difficult to work into the chart, but one I did incorporate was to flag VIX ETFs (from ProShares) in a black font, while all the ETNs are in a blue font.

For the sake of completeness, I also included a necrology of the two VIX ETPs that were closed last year. Interestingly, both were immediately succeeded with virtually identical products that trade under a similar ticker.

Going forward I fear that the next round of VIX ETPs may make it impossible to capture the same level of detail as I have done in this single page, but for now at least, this is my reference of choice for VIX ETPs.

Related posts:

Disclosure(s): long XVZ, short VXX and short TVIX at time of writing

Wednesday, January 18, 2012

SPLV vs. XLP

The more I think about it, the less I understand the need for even more low volatility ETPs. Sure, I understand that in high volatility markets many investors want a more conservative portfolio that is insulated against sharp moves in the wrong direction.

In that respect, I can somewhat understand the appeal of the hugely popular PowerShares S&P 500 Low Volatility Portfolio ETN (SPLV), which has now attracted more than $1 billion in assets in the eight months since it launched. Just last week, in Comparing SPLV and VQT, I noted that SPLV’s approach to lower volatility “is heavy on defensive stocks, with the current top sector allocations in utilities, consumer staples and health care stocks.” In fact, following its recent quarterly rebalancing, SPLV currently has approximately 31% of its portfolio invested in utilities, with another 30% in consumer staples. [see SPLV’s top holdings here]

So what is it that SPLV offers over and above an investment in a utilities ETF like XLU or a consumer staples ETF like XLP? Not much, as far as I can tell. I terms of performance, XLU trounced SPLV throughout 2011 and as the chart below shows, finding a distinction between the performance of SPLV and XLP since the former’s launch last May looks a lot like splitting hairs – though to be fair the gap may become more obvious with the recent rebalancing.

One can argue that other approaches which use low volatility stocks (e.g., XLU) are at least as effective in lowering volatility, as are those ETPs that use a dynamic hedging allocation based on an evaluation of market volatility and risk. I touched on two of these in Comparing SPLV and VQT, notably VQT and VSPY.

As I see it, jumping on the low volatility bandwagon is a lot like shunning air travel because of a fear of turbulence. While that is understandable, that cross-country train is going to make it a much longer trip to get to the same destination.

Considering the differences across the investment universe, I realize that not everyone embraces market volatility as a period in which enhanced opportunities arise, so in 2012 one of the themes I will periodically address in this blog will be how to reduce risk, hedge and generate income – though not necessarily all at the same time.

In the meantime, consider for a moment a personal motto, “In volatility, there is opportunity!

Related posts:

[source(s): ETFreplay.com]

Disclosure(s): none

Friday, January 13, 2012

Comparing SPLV and VQT

Based on some of the questions and comments that came out of Wednesday’s Three New Risk Control ETFs from Direxion, there appears to be a significant portion of the investment community that is uncertain about just how some ETPs are attempting to dampen volatility and control risk.

Today I am going to differentiate between three types of risk control approaches and compare two ETPs that have a little performance history. The approaches and an example ETPs are as follows:

  1. Using low beta stocks to minimize portfolio volatility (SPLV)
  2. Using a market timing mechanism that dynamically allocates between stocks and bonds according to measures of market volatility (VSPY)
  3. Using a market timing mechanism that dynamically allocates between stocks and VIX futures according to measures of market volatility (VQT)
While it may be partly semantics, I would not call SPLV a hedge in the sense that it does not attempt to hold securities that are negatively correlated with stocks. Instead, this approach is heavy on defensive stocks, with the current top sector allocations in utilities, consumer staples and health care stocks (see SPLV’s top holdings here.)

On the other hand, the approaches employed by VSPY and VQT are hedges in the traditional sense in that they switch into asset classes (bonds and volatility) that are generally negatively correlated with stocks when measures of volatility such as implied volatility and historical volatility signal an environment that poses greater risk to long equity positions.

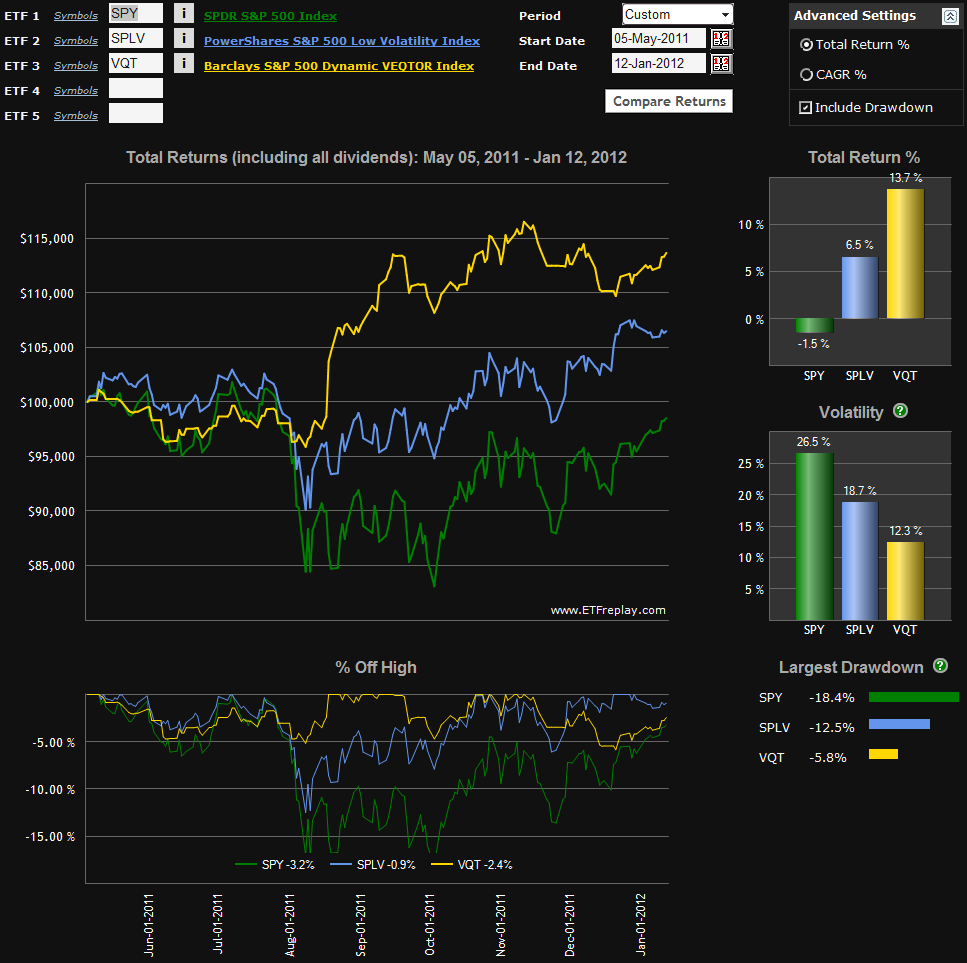
As VSPY was just launched this week, it is too early to talk about the performance of this approach, but the chart below captures the performance of both SPLV and VQT since the launch of the former on May 5, 2011.

Note that both SPLV and VQT are less volatile than SPY, had a lower drawdown, had a smaller peak to trough drawdown during the August-October selloff, and dramatically outperformed SPY during the period covered by the chart. Once VSPY establishes some meaningful historical data, I will return to this subject and offer a more detailed comparison of all three approaches to controlling risk.

For those interested in pursuing some of these subjects further, there is a good deal of information in the links below.

Related posts:
 
[source(s): ETFreplay.com]


Disclosure(s): none

Wednesday, January 11, 2012

Three New Risk Control ETFs from Direxion

Today Direxion announced they have launched three ETFs whose intent is to match their exposure to an underlying equity index based upon current levels of market volatility. The new ETFs are as follows:

  • Direxion S&P 500 RC Volatility Response Shares (VSPY)
  • Direxion S&P 1500 RC Volatility Response Shares (VSPR)
  • Direxion S&P Latin America 40 RC Volatility Response Shares (VLAT)

The launch of these ETFs expands Direxion’s stable of what they call “rules-based index ETFs,” which began with two ETFs that are based on insider trading data: INSD and KNOW. The three new ETFs also arrive just five days after S&P announced a new S&P Dynamic Rebalancing Risk Control Index Series, which provides the basis for evaluating volatility and matching equity exposure to anticipated risk.

The intent of these ETFs is spelled out by Direxion:

“The Funds embody a rules-based investment approach that uses volatility as a gauge to determine equity exposure. They operate according to the principle that exposure to equities should be reduced during periods of higher overall market volatility, and increased during periods of a more stable (lower volatility) market environment. Each Fund has a target volatility level for its corresponding index. When volatility moves above those levels, the Funds will increase their exposure to U.S. Treasuries and decrease their exposure to equities. The Funds will proportionately increase exposure to equities during periods of low market volatility.”

Readers with sharp memories may recall that back in July 2010, Direxion was the first ETF provider to announce that they would be launching a product based on the S&P 500 Dynamic VEQTOR Index, which was an effort to mitigate risk with a dynamic allocation of VIX short-term futures, essentially the equivalent of sizing a VXX hedge based on observed levels of implied volatility and historical volatility. I am not sure why Direxion’s VEQTOR product never saw the light of day, but Barclays ended up with one of the few successful VIX ETPs in 2011 (see VIX Exchange-Traded Products: The Year in Review, 2011) with its Barclays ETN+ S&P VEQTOR ETN (VQT) product, which I made a strong case for back in October 2010 in The Case for VQT.

One of the interesting aspects of the approach taken by VSPY, VSPR and VLAT is that these products will tend to have minimum exposure when the VIX is at its highest – and as anyone who has ever looked a chart of the VIX and SPX/SPY knows, this is typically when stocks bottom and begin a sharp bullish move.

With impeccable timing, EconomPic Data just happened to publish a study yesterday, VIX as a Predictor of Equity Returns, which concluded that for the most part, SPY daily returns were much higher with an elevated VIX than with a historically low VIX.

All this raises the question of how to play increased volatility and risk. In the land of ETPs, there are quite a few alternatives, including:

  • Barclays ETN+ S&P VEQTOR ETN (VQT) – dynamically hedge with a long VIX futures position
  • Direxion’s VSPY and VSPR to dynamically adjust exposure to equities
  • PowerShares low volatility (SPLV) and high beta (SPHB) approaches for manual market timing
  • ETRACS Fisher-Gartman Risk On ETN (ONN) and ETRACS Fisher-Gartman Risk Off ETN (OFF) – for those who wish to manually time the multi-asset class risk on/risk off trade

Investors who believe they are more adept at timing the market may prefer to avoid the rules-based products that dynamically adjust exposure based on a static risk measurement mechanism. For those who prefer not to watch their portfolio closely or are not convinced that they can do a better job than the likes of VQT, VSPY and perhaps SPLV, the new category of dynamic risk exposure products should provide some excellent tools for portfolio augmentation and in some cases, portfolio replacement.

Related posts:

Disclosure(s): short VXX at time of writing

Tuesday, December 27, 2011

Q & A: The Historical Volatility of VQT

Questions from readers are where I get to learn which aspects of volatility cause the most confusion and consternation among investors, so one of the things I will strive to do in 2012 is take more of the Q&A exchanges that might be buried in the comments sections of previous posts and shine some light on them here.

I was reminded of the importance of Q&A when I stumbled upon the following comment to VIX Exchange-Traded Products: The Year in Review, 2011, which I fear may have been lost in the holiday shuffle. [For the record, I tagged that post with my elusive “hall of fame” label, which I typically use to honor only handful of posts each year.]

The comment/question was posted as follows:

Thank you for alerting me to VQT. Where does one find the realized volatility number on it...or is this number just the VIX?

Before I dive into the issue of the realized or historical volatility (the two terms are synonymous) of VQT, I would be remiss in not pointing out that the question suggests some confusion between realized volatility and the VIX.

First things first, realized volatility is also known as historical volatility because it is based on past price moves, has already been observed, and can be calculated with great precision (see Calculating Centered and Non-Centered Historical Volatility for more details.) This is essentially what an investor sees out his or her rear view mirror.

Implied volatility is a very different animal from its realized/historical cousin. It boils down to the market’s best guess as to what (historical) volatility will look like in the future, based on how much investors are currently paying for options. The VIX is a specific instance of implied volatility and is based on options on the S&P 500 index over the course of the next 30 days. To return to the car analogy, it is what the consensus of drivers believe will be around the next bend and over the horizon.

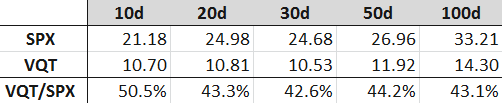
Getting back to VQT, the chart below captures historical volatility based on past daily price moves in VQT for lookback periods of 10 days, 20 days, 30 days, 50 days and 100 days. As these are calculated based on price moves, they are necessarily based on trading days, not calendar days, which are the unit of time used for implied volatility data.

Looking at the table, these historical volatility numbers for VQT are in 10.50 - 10.90 range for the past 30 trading days. The 100-day lookback window takes us back to early August, so it is not surprising that 100-day historical volatility is higher at 14.30.

I have also included some historical volatility data for the S&P 500 index (SPX) for comparison purposes. Note that historical volatility for the SPX has been 100 – 130% higher than it has been for VQT during the same lookback periods.

One can find historical volatility data on sites from brokers that specialize in options (optionsXpress, TradeMonster, Trade King, thinkorswim/TD Ameritrade, etc.) or from options data providers such as Livevol and iVolatility.

Related posts:


Disclosure(s): 

optionsXpress, TradeMonster, Trade King and Livevol are advertisers on VIX and More

Friday, December 23, 2011

VIX Exchange-Traded Products: The Year in Review, 2011

The year is not quite over, but I can safely predict that it when it is in the books, there will be no doubt that 2011 has been a bull market for VIX exchange-traded products (ETPs). After seeing two VIX ETPs launched in 2009 and ten in 2010, this year has witnessed the launch of 20 VIX ETPs.

In the week ahead I will provide some commentary about the evolution of VIX ETPs in 2011 and what to look for in 2012, but for now I wanted to share a performance table for a cross-section of VIX ETPs that were open for the full year.

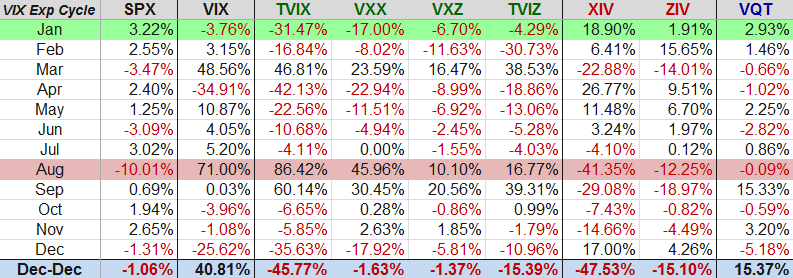
Before I touch upon on the graphic below, I wanted first to comment on the time periods used for the performance data. Now perhaps my life is too complicated, as it seems I have to simultaneously sync it to three different calendars: the standard Gregorian calendar, the options expiration calendar (particularly the standard Friday monthly and weekly expirations) and the VIX options expiration calendar (featuring VIX options and futures expiration on those Wednesdays highlighted by purple squares in the preceding link.) The graphic below uses the VIX options expiration cycle, specifically measuring from Tuesday’s close immediately before VIX options expiration to the next Tuesday’s close just prior to VIX options expiration the following month. This means that the January 2011 entry includes the full VIX options expiration cycle for that month: December 22, 2010 – January 18, 201. This also means the most recent December 2011 data covers the full December VIX options expiration cycle: November 16, 2011 – December 20, 2011.

In the graphic below, I have highlighted the best performing (VIX expiration cycle) month for the SPX in green and the worst performing month in red. Note that over the course of the full year (December 22, 2010 – December 20, 2011) each of the VIX ETPs (long volatility in green and short volatility in red) managed to lose value, even though the VIX was up over 40% during that period. The one exception is VQT, which consists largely of a SPY position, with a dynamic allocation of VXX that ranges from 2.5% to 40% of the ETPs holdings. [For more information on VQT, refer to The Case for VQT and Barclays VEQTOR ETN (VQT) Begins Trading.]

While it is interesting that both the long and short volatility ETPs were unable to turn a profit for the year, there were stretches during 2011 that various VIX ETPs produced extraordinary gains.

As promised, I will delve more into the performance of the universe of VIX ETPs and their suitability as speculative and hedging plays before the end of the year and in the weeks and months ahead.

Related posts:

Disclosure(s): long XIV, ZIV and VQT; short TVIX and VXX at time of writing

Thursday, November 11, 2010

The Evolving VIX ETN Landscape

As of today, only four VIX exchange-traded products (ETNs and ETFs) are available for trading. All of these have been Barclays products and three of the four carry the iPath brand name. In descending order of volume, the VIX-based ETNs currently being traded are:

  • iPath S&P 500 VIX Short-Term Futures ETN (VXX)
  • iPath S&P 500 VIX Mid-Term Futures ETN (VXZ)
  • iPath Inverse S&P 500 VIX Short-Term Futures ETN (XXV)
  • Barclays ETN+ S&P VEQTOR ETN (VQT)
Five other companies (ProShares, Direxion, Citigroup, Jefferies and Bank of America) have VIX-based ETNs and ETFs (in the case of ProShares) in registration or have made announcements about forthcoming products, but I am unaware of any target launch dates.  In order to simplify matters a little, henceforth I will start to refer to these products as exchange-traded products or ETPs.

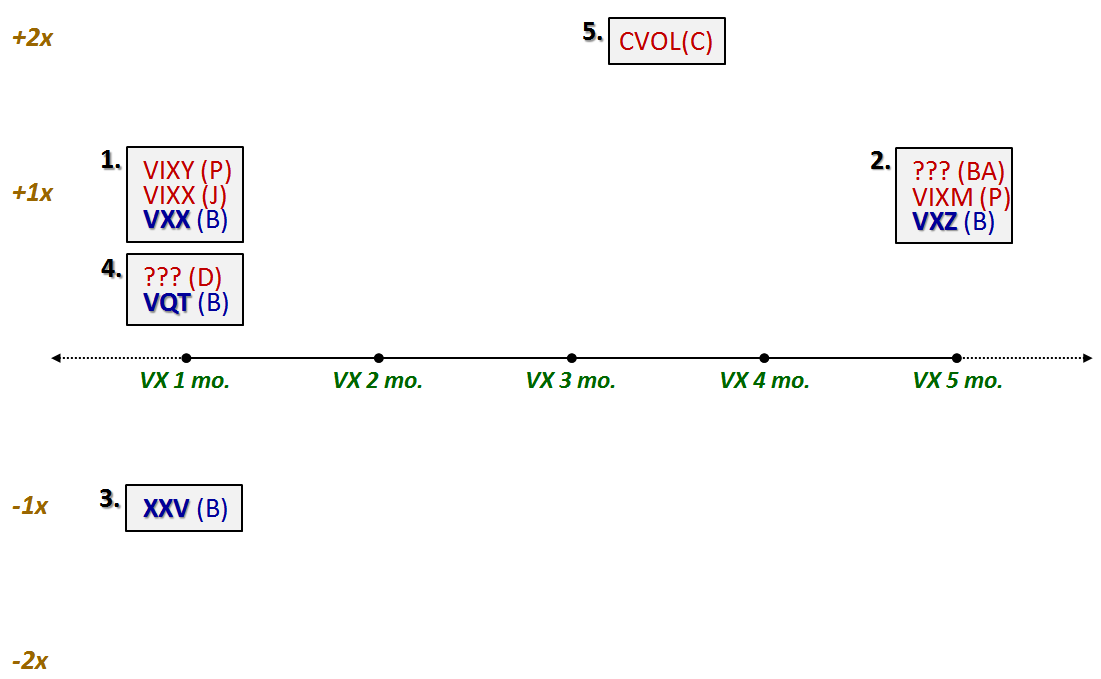
In order to attempt to simplify and catalog the growing universe of available and announced VIX-based ETPs, I have assembled the chart below. The chart uses the y-axis to plot the leverage used (all are standard +1x ETPs, with the exception of the +2x CVOL and the sole inverse product, the -1x XXV) and the x-axis to plot the target maturity. VX 1 mo. is short for VIX futures with a constant maturity of one month, etc.

I have identified each ETP by its ticker (I do not yet have tickers for the Direxion or Bank of America products) and have coded these with a one or two letter suffix to identify the issuer (P for ProShares, D for Direxion, C for Citigroup, J for Jefferies and BA for Bank of America.) ETPs that are currently traded are in bold blue; ETPs that have not yet been launched are in red font.

The final piece of information involves grouping the ETPs into five clusters which represent the five approaches currently being used for VIX-based ETPs. For all intents and purposes, the ETPs in each cluster are (or appear to be, at this juncture) equivalent in construction and should behave in a similar manner. Group #1 for instance, has been the dominant theme in the volatility ETP space to date. The focus here is on VIX futures with a constant maturity of 30 days. VXX was the first to market, but competitive offerings from Jefferies and ProShares are on the way. Group #2 uses a similar approach, but with a 5-month target maturity. Group #3 is the inverse of Group #1.

Group #4 represents what I consider to be a second generation of products, with a dynamic allocation of 2.5% to 40% (see Barclays VEQTOR ETN Begins Trading for details), which is why the group is shown here as having less than +1x leverage.

The newest VIX ETP approach comes from Citigroup, where their CVOL product not only targets a new portion of the VIX futures term structure (3-4 months), but adds a +2x leverage component and also includes a “variable weighted short position in the S&P 500 Total Return Index” as well.

Things continue to get more and more interesting in the VIX ETP space. I look forward to the launch of some of these newer products and to seeing how they perform.

It should go without saying that as the VIX ETP landscape continues to evolve, I will do my best to attempt to map it in a meaningful manner.

Related posts:


Disclosure(s): none

Thursday, October 14, 2010

The Case for VQT

Many investors, present company included, are sitting on sizeable gains from long positions going back as far as March 2009. With the S&P 500 up 16% from its recent July 1st low of 1010 and looking like it may take another run at 1200 sometime soon, longs are torn between the desire to lock in some profits on the one hand and have the potential to benefit from further upside on the other hand.

While there are a number of ways to approach this problem, a new off-the-shelf strategy became available with the launch of Barclays ETN+ S&P VEQTOR ETN (VQT) on September 1st.

To briefly recap, VQT is essentially a portfolio with two components: a long SPY component and a long VXX component. At the end of each day, the ETN evaluates volatility risk and based upon rules which incorporate realized volatility and implied volatility, determines how much the SPY positions should be hedged with VXX. The result is a dynamically hedged long position that is hedged with volatility. The SPY component of VQT is set to vary in a range of 60-97.5%, with the VXX component comprising the balance of the VQT at anywhere from 2.5-40%.  VQT also has another intriguing portfolio allocation feature that none of the other volatility ETNs have:  a stop loss provision which overrides all other allocations.  This stop loss provision is triggered whenever VQTs 5-day return falls below -2%, at which point the ETN's portfolio automatically switches to 100% cash and remains at 100% cash until the 5-day return rises above -2%.

The chart below shows that VQT is structured not only to limit losses in an environment of increased volatility, but also profit in some high volatility scenarios.

Since VQT is perhaps the most complex actively managed ETN that is traded, I highly recommend that readers study the pricing supplement for VQT, the highlights of which I sketched out in Barclays VEQTOR ETN (VQT) Begins Trading.

Finally, I feel obliged to mention that to date VQT has only managed to trade about 5,000 shares per day, on average. While market depth is not great, the spread is consistently in the area of about 0.06 – which is not bad considering that VQT is trading over 105 as I type this. As is the case with any exotic ETN, there is no guarantee VQT will attract sufficient interest to become a permanent fixture on the investing landscape, which would be a shame, because I believe this ETN has considerable potential.

For those who think they might have an interest in this product further on down the line, I have one thought: use it or lose it!

Related posts:

 
[source: Barclays]
 
Disclosure(s): long VQT and short VXX at time of writing

Thursday, September 2, 2010

Barclays VEQTOR ETN (VQT) Begins Trading

Both volatility traders and long-term investors should be interested to know that Barclays launched the launched the ETN+ S&P VEQTOR ETN (VQT) yesterday. Flying mostly under the radar, this ETN traded only 300 shares in its first day. That being said, I think VQT is probably the most interesting volatility product launched to date, with dynamic hedging rules that make it the first actively managed off-the-shelf volatility product for the retail investor.

I promise a more detailed analysis of VQT in the near future, but for now suffice it to say that the ETN essentially consists of a long position in the S&P 500 index, hedged with a volatility position (VXX) that varies daily, based on how the ETN evaluates volatility risk, largely using realized volatility and implied volatility calculations. The table below shows that the two main inputs into determining the VXX allocation are the current level of realized volatility and the direction of the implied volatility trend. The equity component of VQT is set to vary in a range of 60-97.5%, with the volatility component comprising the balance of the VQT at anywhere from 2.5-40%.

The concept behind VQT is an extremely attractive one, as it includes some built-in disaster insurance in the form not just of a volatility hedge, but also a stop loss feature, which is triggered whenever the 5-day return of the VEQTOR index on which VQT is based is equal to or less than -2.0%.

The specific implementation of volatility rules deserves more detailed treatment, which I will take up in subsequent posts. In the meantime, readers are encouraged to study the pricing supplement for VQT.

Note that VQT bears an extremely strong resemblance to a forthcoming VEQTOR product from Direxion that I discussed a little over a month ago in Direxion and S&P Bring Dynamic Volatility Hedging to ETFs with VEQTOR.

Related posts:


[source: Barclays]

Disclosure(s): neutral position in VXX via options

DISCLAIMER: "VIX®" is a trademark of Chicago Board Options Exchange, Incorporated. Chicago Board Options Exchange, Incorporated is not affiliated with this website or this website's owner's or operators. CBOE assumes no responsibility for the accuracy or completeness or any other aspect of any content posted on this website by its operator or any third party. All content on this site is provided for informational and entertainment purposes only and is not intended as advice to buy or sell any securities. Stocks are difficult to trade; options are even harder. When it comes to VIX derivatives, don't fall into the trap of thinking that just because you can ride a horse, you can ride an alligator. Please do your own homework and accept full responsibility for any investment decisions you make. No content on this site can be used for commercial purposes without the prior written permission of the author. Copyright © 2007-2023 Bill Luby. All rights reserved.
 
Web Analytics