VIX ETPs Flash Some Green in 2016
Last year I
shocked quite a few investors and media outlets with the publication of Every
Single VIX ETP (Long and Short) Lost Money in 2015. My intent was not to tar and feather the VIX
exchange-traded products landscape, but to highlight the fact that in an
environment characterized by sharp VIX spikes and
other volatility extremes, the power of volatility compounding price decay can
overwhelm both long and inverse ETPs.
In sharp
contrast to across-the-board losses in 2015, the performance of VIX ETPs in
2016 was much more balanced and in line with historical norms. While there were some sharp VIX spikes, the
combination moderate
volatility, above-average contango and
persistent mean
reversion translated into a sharp down year for the long VIX ETPs and a
strong up year for the inverse VIX ETPs.
The more complex multi-leg, long-short and dynamic VIX strategy ETPs
were closest to breaking even for the year, with half of these posting modest gains
and half posting small losses.
In the graphic
below, I have plotted the performance of all twenty VIX-based ETPs with respect
to leverage and maturity, using leverage on the y-axis and maturity on the x-axis. This group includes five VIX
strategy ETPs that have no easily discernible point on the leverage-maturity
grid. Depending on how finely you wish
to split hairs, these twenty ETPs account for anywhere from
fourteen to eighteen unique ways to trade volatility long and short, across
various maturities and according to a wide variety of strategic
approaches.

[source(s): VIX and More]
On the plus
side, while both XIV
and SVXY were up
over 80% during calendar 2016, this performance falls short of the 2012 and
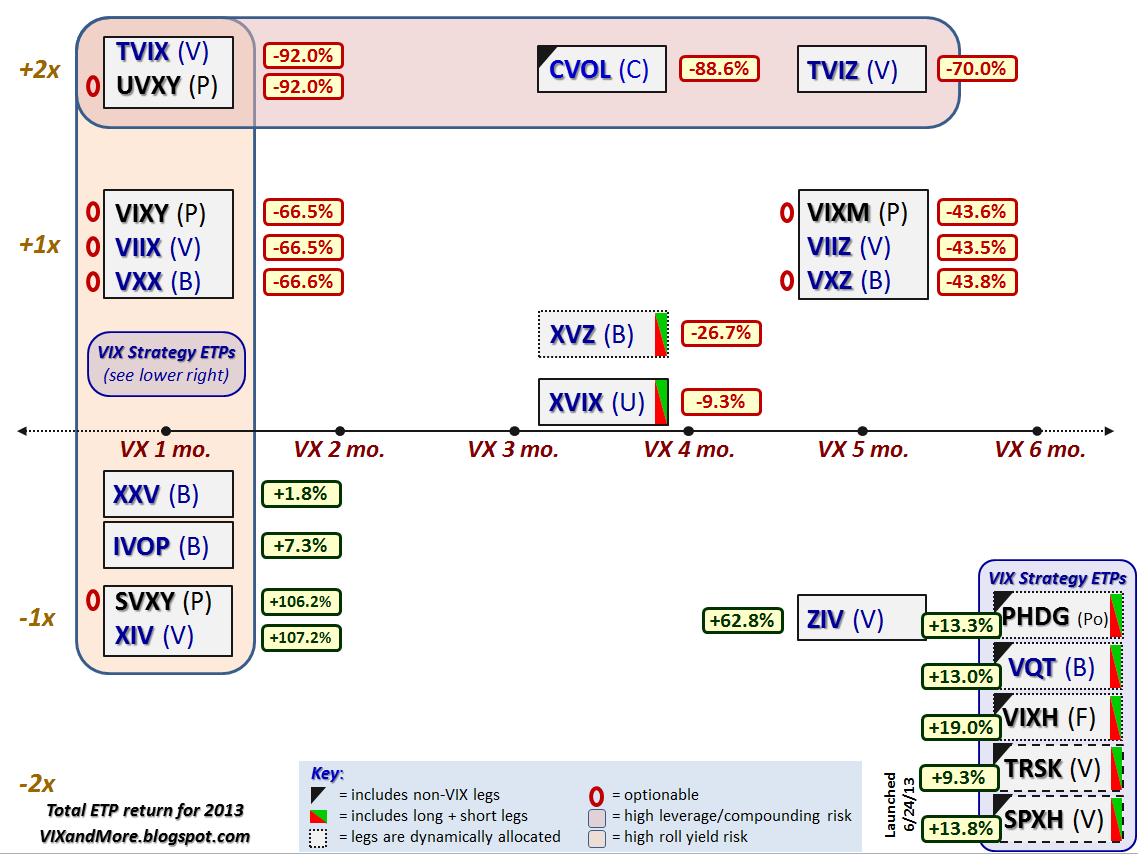
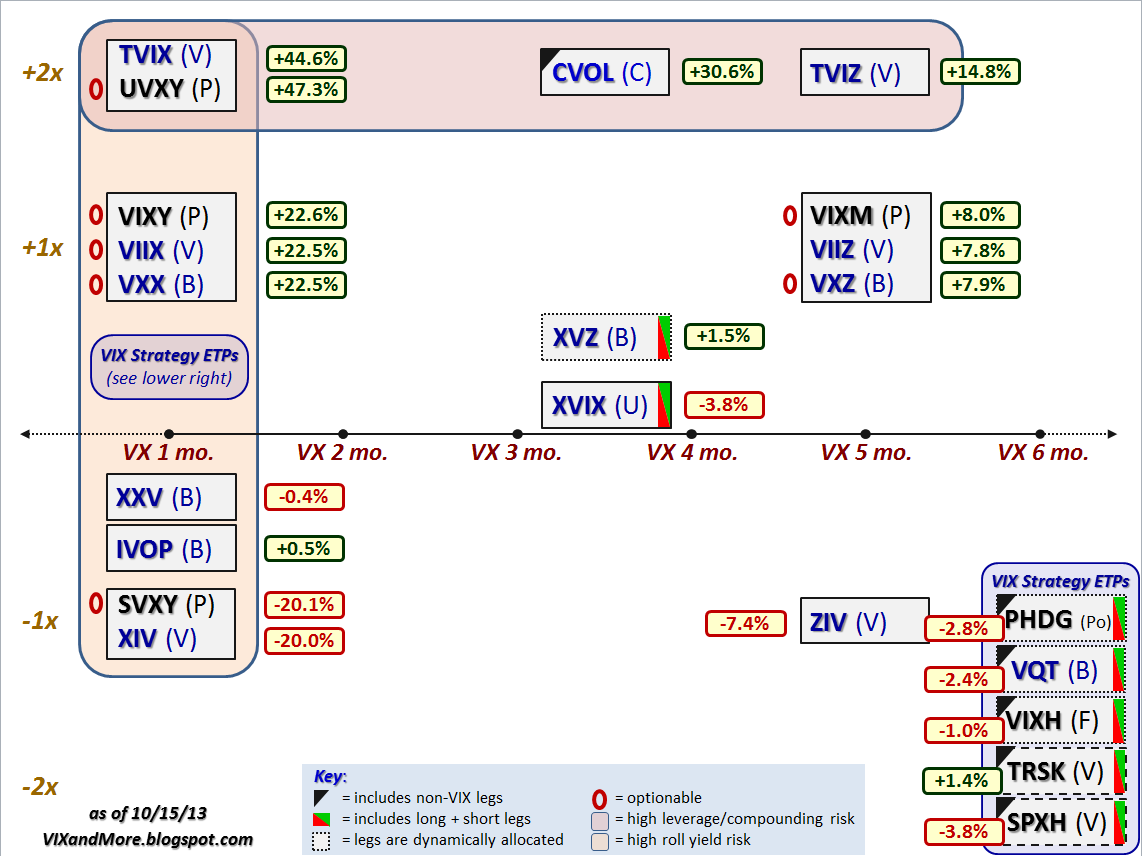
2013 numbers, where each ETP gained more than 100% in both years. Similarly, while losses of over 93% for UVXY and TVIX must sound
like a worst-case scenario for these two products, losses were over 97% in 2012
and just slightly better – at -92% – in 2013. In terms of consistent winners, while their numbers have been more modest, the most consistent gainers in the VIX ETP space have been ZIV, TRSK and SPXH.
Two new VIX ETPs entered the fray in 2016: VMIN and VMAX. While these products have not yet attracted the interest of investors that I believe is warranted (VMAX and VMIN Poised to Be Most Important VIX ETP Launch in Years), there is still time for investors to discover these products. For the record, VMIN was launched on May 2, 2016 and outperformed both XIV and SVXY from the launch date until the end of the year, racking up an impressive 80.5% return in just eights months of trading. Going forward, I would expect VMIN to regularly be the top performer in any period in which the inverse ETPs post positive returns.
Two new VIX ETPs entered the fray in 2016: VMIN and VMAX. While these products have not yet attracted the interest of investors that I believe is warranted (VMAX and VMIN Poised to Be Most Important VIX ETP Launch in Years), there is still time for investors to discover these products. For the record, VMIN was launched on May 2, 2016 and outperformed both XIV and SVXY from the launch date until the end of the year, racking up an impressive 80.5% return in just eights months of trading. Going forward, I would expect VMIN to regularly be the top performer in any period in which the inverse ETPs post positive returns.
For those who
may be wondering, the VIX index was down 22.9% for the year, while the front
month VIX
futures product ended the year with a loss of 18.3%.
As is typically the case, contango was a
significant performance driver during the course of the year. Contango affecting the front month and second
month VIX futures averaged a relatively robust 8.3% per month during the year
(the highest since 2012), while contango between the fourth month and seventh
month was slightly above average at 1.8% per month.
During the
course of the year, five VIX ETPs were shuttered.
These include VXUP
and VXDN, XVIX, CVOL and VQTS. The biggest factors in the demise of these
products was a lack of volume and assets.
In the case of VXUP and VXDN, the product complexity and cumbersome
array of distributions also helped to quell investor enthusiasm. Last but not least, I elected to drop XXV
and IVOP
from this list as these zombie ETPs both have less than 1% exposure to their
underlying volatility index due to the lack of daily rebalancing. As a result, these have become almost
entirely all-cash vehicles, with a dash of volatility. (For those who are curious about these
instruments, follow the links above, click on the link to the prospectus and do
a keyword search for “participation.”)
As an aside, for those who
may be wondering, the flurry of recent posts is not an anomaly. There is a lot to be said about the VIX, volatility,
ETPs, market sentiment and many of my other areas of interest. With the
the-year anniversary of the VIX and More blog just three days away, this seems
like a good time to dive head first back into the fray.
Related posts:
- The Year in VIX and Volatility (2016)
- The 2016 VIX Futures Term Structure: Extraordinarily Average
- My Low Volatility Prediction for 2016: Both Idiocy and Genius
- Every Single VIX ETP (Long and Short) Lost Money in 2015
- Performance of VIX ETPs in 2013
- Performance of VIX ETPs During the Recent Debt Ceiling Crisis
- VIX ETP Performance in 2012
- Expanded Performance of Volatility-Hedged and Related ETPs
- Performance of Volatility-Hedged ETPs
- Performance of VIX ETP Hedges in Current Selloff
- Comparing SPLV and VQT
- ZIV Undeservedly Neglected
- Will TVIX Go To Zero?
- Four Key Drivers of the Price of TVIX
- Credit Suisse Suspends Creation Units in TVIX: What It Means
- TVIX Creation Units Return: What It Means for Investors
- All About UVXY
- The Case for VQT
- Slicing and Dicing all 31 Flavors of the VIX ETPs
- Charting the Assets of the Volatility-Based ETPs
- Why VXX Is Not a Good Short-Term or Long-Term Play
- VXX Calculations, VIX Futures and Time Decay
- First Day of Trading in VXX and VXZ a Success
Disclosure(s): net short VXX, VMAX, UVXY and TVIX; net long
XIV, SVXY and ZIV at time of writing