Showing posts with label realized volatility. Show all posts

Tuesday, October 16, 2012

Ratio of VIX to Realized Volatility Higher Than Any Year Since 1996

Before I dive into a series of posts about the VIX futures, I think it is important to add some context in the form of several observations about the relationship between the VIX and the historical volatility (HV) of the S&P 500 index. In the absence of any information about the future, it turns out that historical volatility (a.k.a. realized volatility or statistical volatility) can provide a reasonably accurate measure of future volatility. In fact, it is more difficult than one might imagine to incorporate information about the future to come up with a better estimate of future volatility than what can be gleaned just by extrapolating from recent realized volatility.

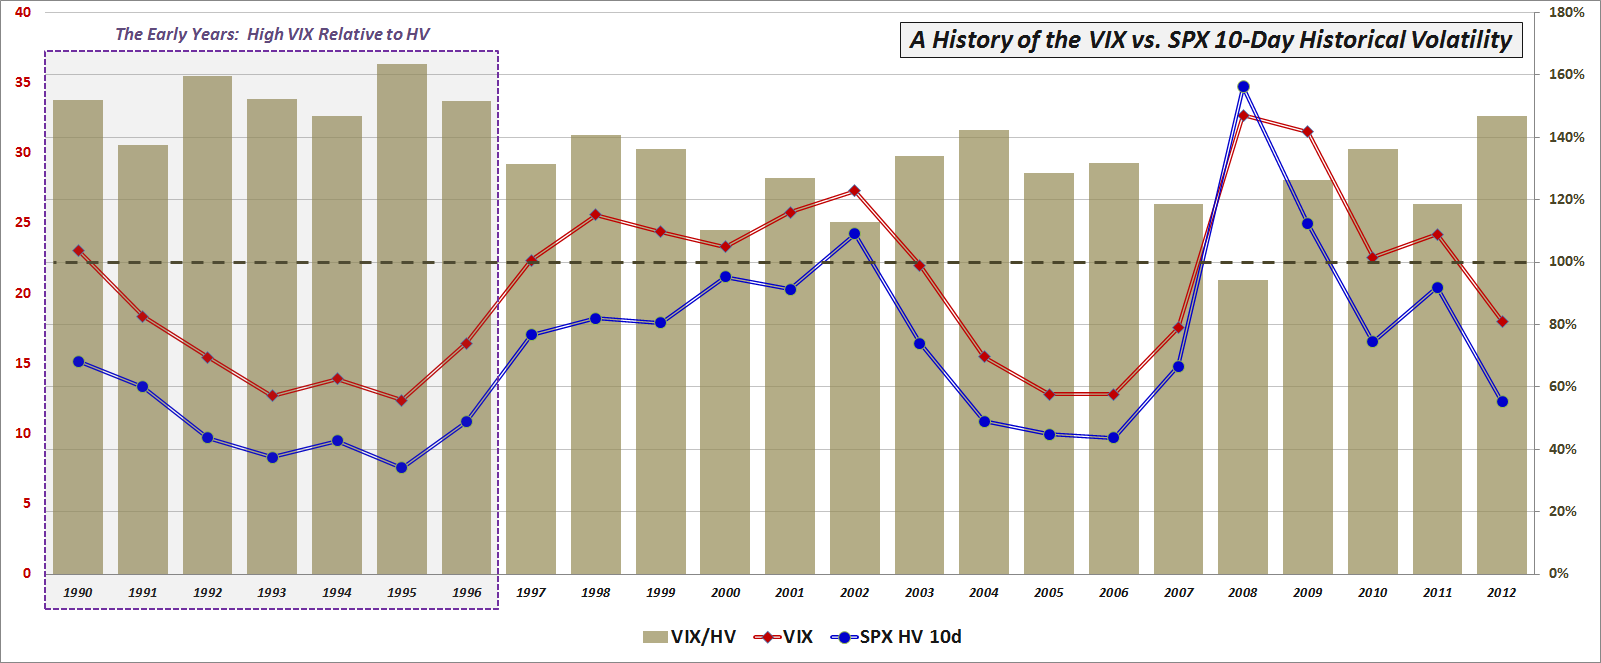
Looking at historical data, the VIX has an established history of overestimating future realized volatility. In fact, in the 23 years of VIX historical data, there was only one year – 2008 – in which realized volatility turned out to be higher than that which was predicted by the VIX.

As the chart below shows, early traders made a habit of dramatically overestimating future volatility. From 1990-1996, for instance, the VIX overshot realized volatility by an average of 49%. Since 1997, the magnitude of that overshoot has dropped dramatically, to about 24%, as investors apparently began to realize that they had been overpaying for portfolio protection in particular and for options in general.
[source(s): CBOE, Yahoo]

That being said, 2012 has been an unusual instance in which the VIX has overestimated 10-day historical volatility in the SPX by 47% – the biggest cushion since 1996. Not surprisingly, low realized volatility tends to depress the VIX and the front end of the VIX futures term structure in general. For that reason, the unusually low average 10-day historical volatility of 12.25 experienced so far in 2012 can serve as a partial explanation for the steepness of the VIX futures term structure (extreme contango) yet given the history of even lower volatility numbers during 2004-2007, the low historical volatility for 2012 is at best a very small portion of the full explanation. Two better potential explanations for the steep VIX futures term structure are the psychology of the 2008 financial crisis and its aftermath (i.e., disaster imprinting, availability bias, the recency effect, etc.) and expectations of future higher volatility due to a geopolitical and macroeconomic overhang that has generated a much higher level of anxiety about future prospects than in more uneventful economic times. Then, of course, there is the issue of the role of mushrooming growth in VIX exchange-traded products as an influence on the VIX futures term structure.

Before I address those issues in more detail, however, the next installment in this series is a discussion of the evolution of the VIX futures term structure.

Related posts:

Disclosure(s): none

Sunday, October 14, 2012

Violent Disagreement Across VIX Futures

Something strange has happened to the VIX futures in 2012: for the first time in their history, the VIX futures persist in being in violent disagreement with each other. Prior to 2012, for instance, the average difference between the front month and seventh month VIX futures was about 16%. This year that number has surged to more than 38%.

The VIX futures term structure has been in extreme contango (back months higher than front months) for the better part of 2012, with 17 days in which the contango across the full VIX futures curve has exceeded the all-time record that stood prior to 2012. It is almost as if the idea of a flat VIX futures term structure curve is passé and traders are convinced that the short-term volatility picture is perpetually an aberration that bears little resemblance to longer-term volatility expectations. Can these two differing perspectives of the future of volatility meaningfully coexist? If not, which view is likely to be wrong?

In a series of upcoming posts, I will put the issue of a VIX futures term structure in disarray under the microscope and discuss issues such as the huge gap between implied volatility and realized volatility, disaster imprinting and the role of the recent financial crisis in shaping future volatility expectations, looming issues such as the European sovereign debt crisis, the fiscal cliff, the potential for a hard landing in China, etc.

Ultimately I will attempt to answer the question of whether the back month VIX futures should be trading at levels that are 45-90% higher than the front month VIX futures, as has been the case for the past two months. I will also look at some of the implications for trading VIX futures, VIX options and VIX exchange-traded products.

In the interim, some of the links below might provide some useful background and context.

Related posts:

Disclosure(s): none

Thursday, September 2, 2010

Barclays VEQTOR ETN (VQT) Begins Trading

Both volatility traders and long-term investors should be interested to know that Barclays launched the launched the ETN+ S&P VEQTOR ETN (VQT) yesterday. Flying mostly under the radar, this ETN traded only 300 shares in its first day. That being said, I think VQT is probably the most interesting volatility product launched to date, with dynamic hedging rules that make it the first actively managed off-the-shelf volatility product for the retail investor.

I promise a more detailed analysis of VQT in the near future, but for now suffice it to say that the ETN essentially consists of a long position in the S&P 500 index, hedged with a volatility position (VXX) that varies daily, based on how the ETN evaluates volatility risk, largely using realized volatility and implied volatility calculations. The table below shows that the two main inputs into determining the VXX allocation are the current level of realized volatility and the direction of the implied volatility trend. The equity component of VQT is set to vary in a range of 60-97.5%, with the volatility component comprising the balance of the VQT at anywhere from 2.5-40%.

The concept behind VQT is an extremely attractive one, as it includes some built-in disaster insurance in the form not just of a volatility hedge, but also a stop loss feature, which is triggered whenever the 5-day return of the VEQTOR index on which VQT is based is equal to or less than -2.0%.

The specific implementation of volatility rules deserves more detailed treatment, which I will take up in subsequent posts. In the meantime, readers are encouraged to study the pricing supplement for VQT.

Note that VQT bears an extremely strong resemblance to a forthcoming VEQTOR product from Direxion that I discussed a little over a month ago in Direxion and S&P Bring Dynamic Volatility Hedging to ETFs with VEQTOR.

Related posts:


[source: Barclays]

Disclosure(s): neutral position in VXX via options

Thursday, July 29, 2010

Direxion and S&P Bring Dynamic Volatility Hedging to ETFs with VEQTOR

As the ETF space continues to evolve and push into new territory, such as strategy-in-a-box ETFs and more actively managed ETFs (e.g., QAI, ALT, PQY, PQZ, GVT, PSR, RWG), it was only a matter of time before a volatility play was added to the pool of actively managed ETFs.

Credit Direxion with being the first to venture into the realm of actively managed ETFs with a strong volatility component. In a recent SEC filing, Direxion unveiled plans to launch an intriguing new ETF under the name of S&P 500 Dynamic VEQTOR Shares. This ETF will seek to track the S&P 500 Dynamic VEQTOR Index, which was launched by S&P back on November 18, 2009.

So far, so good.

Here is where it gets interesting. The VEQTOR index (and ETF) have three components: equity (S&P 500); volatility (S&P 500 Short-Term VIX Futures Index, aka VXX) and cash. Based upon several rules and formulas, the index attempts to derive – on a daily basis – the ideal target volatility allocation. This is accomplished by evaluating realized volatility and implied volatility, determining the implied volatility trend (using 5-day and 20-day IV moving averages) and arriving at a target index volatility allocation based on realized volatility and implied volatility data. Once the target volatility allocation has been determined (the range is from 2.5% to 40.0%), the balance of the index is populated with the S&P 500.

Just to make things more interesting, the VEQTOR index also has a stop loss provision which specifies that if aggregate losses during any five day business period are 2% or higher, the index will move into a 100% cash position.

When the VEQTOR ETF is launched, I will have a lot more to say about this fascinating product. In the meantime, those interested in additional information on the VEQTOR index and ETF should try:

For more on related subjects, readers are encouraged to check out:

Disclosure(s): neutral position on VXX via options at time of writing

Thursday, May 27, 2010

The VIX, Rule of 16 and Realized Volatility

Two days ago, in Rule of 16 and VIX of 40, I discussed the Rule of 16 in terms of translating the (annualized) VIX number into expectations for future daily realized volatility in the S&P 500 index.

That post drew several interesting comments, which unfortunately they now reside somewhere in Disqus limbo. In one of the comments, rafaminos offered the following thoughts:

It seems that VIX is on average higher that realized volatility (based on daily returns over 30 days). I also tried to shift VIX 30 days in advance and the conclusion is the same. Since the historical ratio of the two is 1.45 (VIX/realized volatility), should not we infer from this past relationship that the implied realized volatility is more like 30 (45/1.45), meaning a 2% change 1/3 of the time?

My reply appears to be somewhere in comment purgatory as well, but the essence of my response is as follows:

Over that last 20 years, I get a VIX that is about 1.40 times the SPX 20-day realized volatility. I attribute some of the discrepancy to the high demand for SPX puts as hedges, which tends to inflate the VIX relative to realized volatility (and immediately suggests some strategic implications vis-a-vis short SPX puts strategies.)

So...given that a VIX of 32 is about 1.4x SPX realized volatility and 32/1.4 = 22.9 and 32*1.4 = 44.8, based on the historical evidence, I would conclude that:

1) VIX of 32 – 1/3 of the time the SPX is expected to have a daily change of at least 2%, but...

2a) VIX of 32 – 1/3 of the time the SPX will (based on historical data) have a daily change of at least 1.4%
2b) VIX of 45 – 1/3 of the time the SPX will (based on historical data) have a daily change of at least 2%

For more on related subjects, readers are encouraged to check out:

Disclosure(s): short VIX at time of writing

Sunday, November 22, 2009

Chart of the Week: No More Free Lunch for Volatility Sellers?

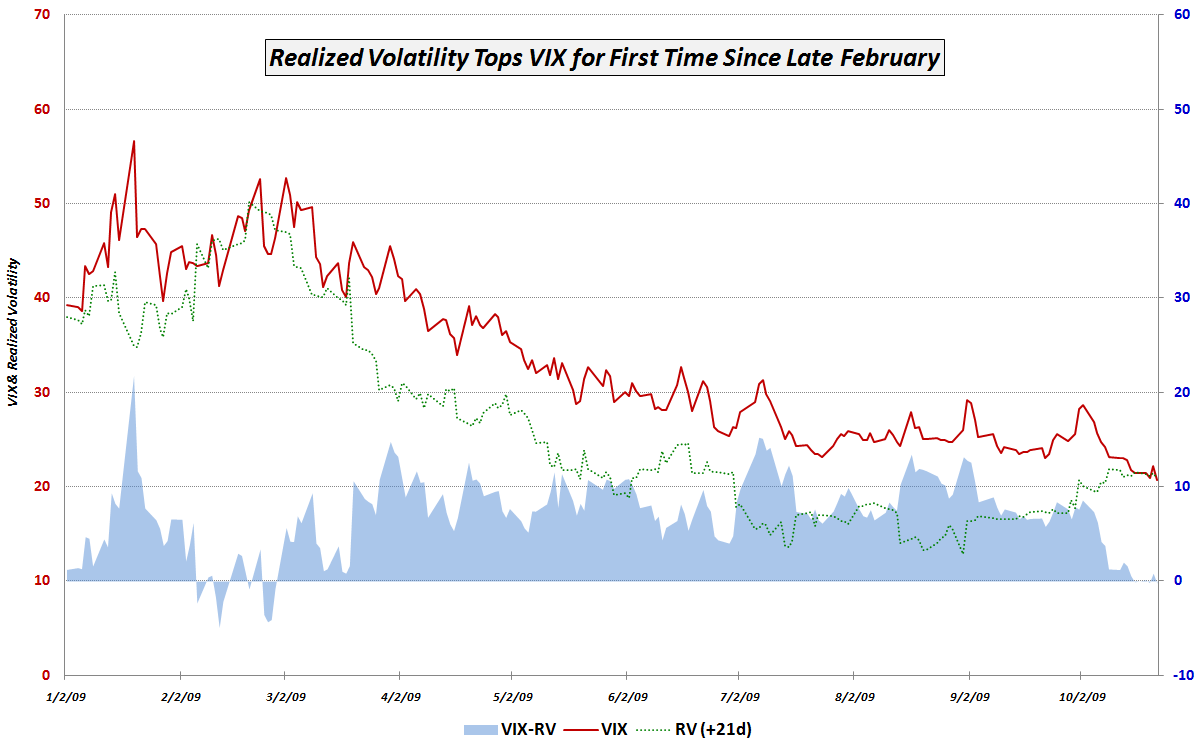
One month ago the VIX closed at a 2009 record low of 20.69, so it should not be a big surprise that realized volatility over the course of the past month has been higher than predicted by the VIX. What I find interesting about this development is that last week was the first time since February 27th (exactly one week before the market bottomed) that 21 day realized volatility turned out to be higher than the level of volatility predicted by the VIX.

What does this mean?

In the chart of the week below, I show the relationship between the VIX and realized volatility 21 days hence since the beginning of the year. The key point to emphasize is that since the beginning of 2009 (actually going back to 11/20/2008) the VIX had anticipated higher volatility that actually occurred in the next 21 trading days in all but 9 trading days in February – until last week. On Monday, Wednesday and Friday of last week, the nine month string was broken, as 21day realized volatility exceed that of the VIX from 30 days ago.

While one may argue about the ability of the VIX and realized volatility to predict market direction (in my opinion, it is a reasonably successful indicator, but a long way from perfect), there is no arguing that those who have been selling volatility and pocketing easy money since the March bottom in stocks are now finding that the ‘volatility gap’ which had been providing such reliable profits is no longer intact.

Going forward, I think the gap between the VIX and realized volatility should be watched for market direction clues, but more importantly, it should provide clues about whether opportunities to sell volatility for an easy profit are still available – and thus provide a window into the mind of options traders.

For additional posts on related subjects, readers are encouraged to check out:

Wednesday, November 11, 2009

VIX Data to Support Availability Bias and Disaster Imprinting Hypothesis

At the risk of beating to death last week’s theme of availability bias and disaster imprinting as part of the explanation for some of the “realized volatility gap, persistent VIX futures contango and off-center VIX:VXV ratio,” I thought it might be informative to present a simple piece of research which supports the idea that the 2009 volatility picture has been an extremely abnormal one.

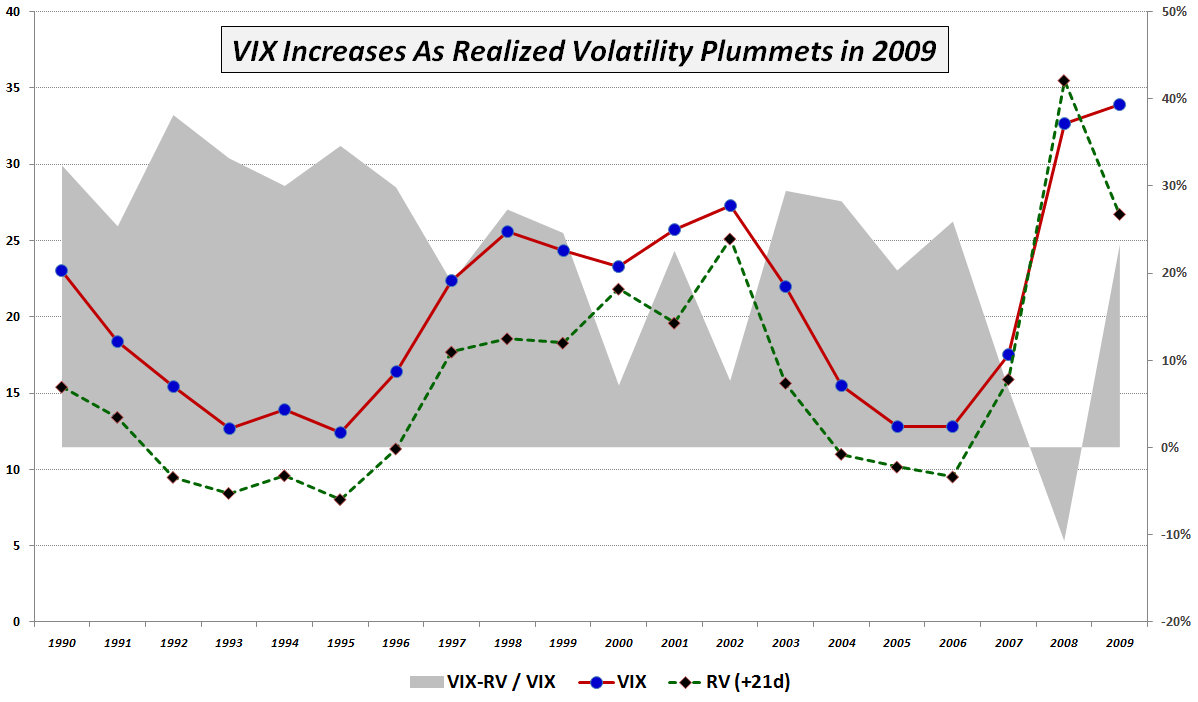
In the 20 years of VIX historical data, the VIX has typically overestimated the realized volatility 21 trading days hence, which is reflected in the chart below by the dotted green RV (+21d) line. In fact, the gray area portion of the graphic, which represents the difference between the VIX and realized volatility 21 trading days later, was close to 30% in the first half of the 1990s; more recently it has been averaging closer to 20%. The VIX actually fell below realized volatility for 2008, which is not surprising, given the volatility extremes of October and November. What is particularly noteworthy about this chart, however, is that during 2009 the VIX is actually 3.8% higher than it was in 2008, which realized volatility has actually fallen 24.7%. It is almost as if the VIX refuses to believe that realized volatility is declining and insists that the gravitational forces of mean reversion be suspended until further notice. This is a large part of the reason why 2009 has been a boon to options sellers.

For additional posts in this series, which I have listed in reverse chronological order, readers are encouraged to check out:

Wednesday, November 4, 2009

The VIX:VXV Ratio, Availability Bias and Disaster Imprinting

Once a popular subject in this space, the VIX:VXV ratio appeared to be a casualty of the financial turmoil and record volatility spikes in October 2008, when the ratio spiked to record levels an generated a buy signal that turned out to be nothing short of a disaster.

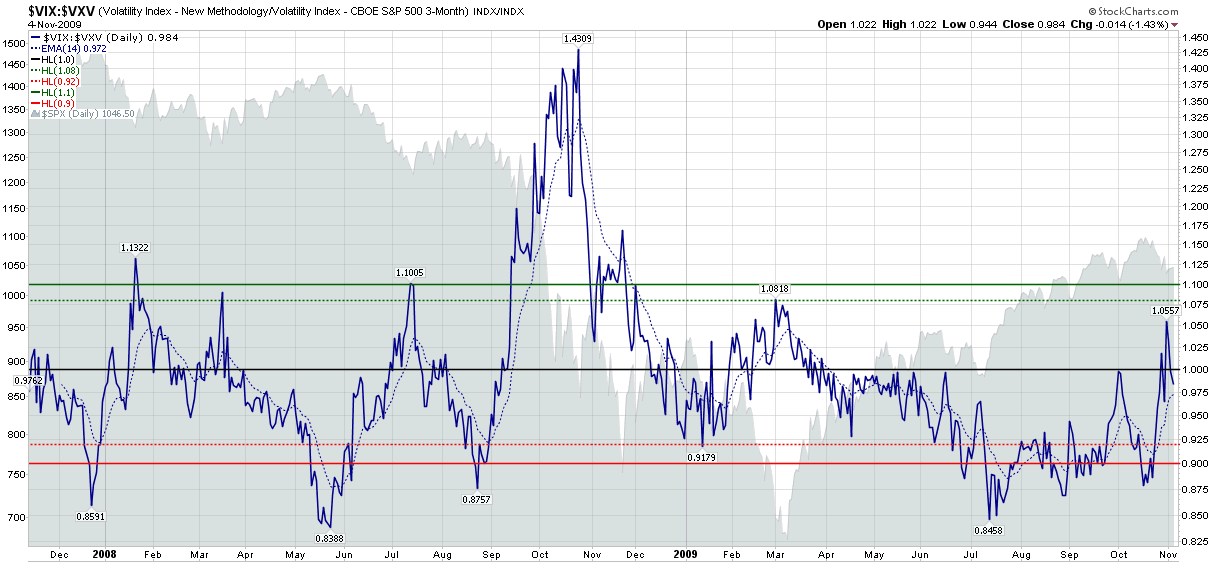
I was not yet ready to give up on the VIX:VXV ratio, so I was pleased to see that from November to January it generated some helpful long and short signals. In a promising development, on March 2nd the ratio generated a buy signal just before the markets bottomed. When the VIX:VXV ratio urged caution in June, I had even more reason to be hopeful. Then, once again, the ratio had another big miss, issuing a sell signal in mid-July just after the markets started rallying. To compound matters, instead of moving back toward the neutral zone (between 0.92 and 1.08), the ratio persisted with a bearish recommendation all the way to the October top.

I was just about to consign the VIX:VXV ratio to the “Sometimes Useful But Not Always Consistent” bin, but decided to reconsider when I started thinking about volatility levels in the context of availability bias and disaster imprinting, as well as The Gap Between the VIX and Realized Volatility and VIX Spike and VIX Futures Contango Means… As I see it, all these subjects are related. The realized volatility gap, persistent VIX futures contango and off-center VIX:VXV ratio (see chart below) are all symptoms of a market that is not functioning as it normally does, while availability bias and disaster imprinting are the main causes of this situation.

Further, the fact that the VIX futures term structure is now flat and the VIX:VXV ratio hit a new post-March 6th high of 1.056 last Friday suggests that the volatility picture may be starting to assume some of its pre-Lehman characteristics – if not exactly returning to a ‘normal’ state of affairs.

Personally, I still think the VIX is a little higher now than realized volatility will be a month from now, but a high VIX relative to realized volatility may turn out to be one of the more persistent effects of the global financial crisis, as each investor has their own personal half-life for how long availability bias and disaster imprinting will cast a shadow on their view of the investment landscape.

For additional posts on some of the above subjects, readers are encouraged to check out:

[source: StockCharts]

Disclosure: Short VIX at time of writing.

Wednesday, August 19, 2009

The Gap Between the VIX and Realized Volatility

Since making an all-time closing high of 80.86 on November 20th 2008, the CBOE Volatility Index (VIX) has been declining in the direction of its historical mean of 20.22. While the initial drop in the VIX took it rapidly from 80 to the 40-50 range, it took some time before investors began to gain confidence that the March lows in stocks were going to be the bottom. Once the consensus began to build around the likelihood of a bottom and a historic buying opportunity in stocks, the VIX began a steady descent that has taken it all the way down to the mid-20s.

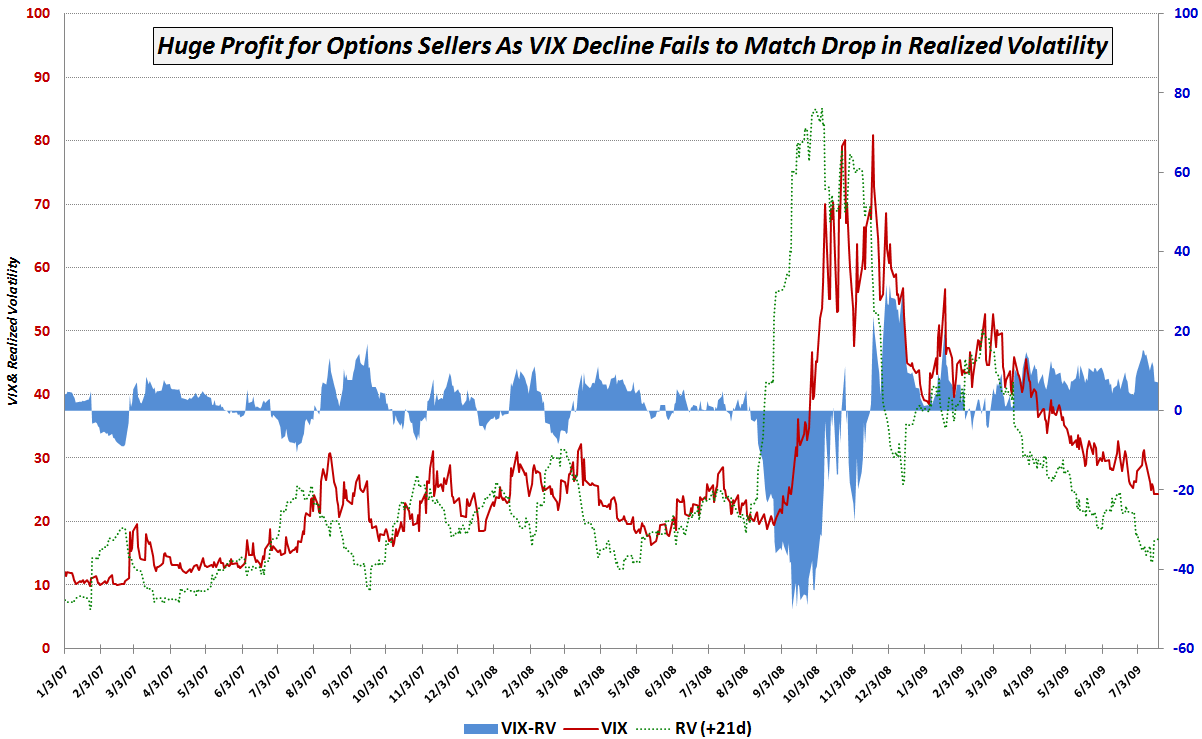
As the chart below demonstrates, as rapidly as the VIX (red line) has been able to fall, it has not managed to keep up with the decline in realized volatility. The chart records the closing VIX value for each day as well as the 21-day realized volatility (dotted green line) that results from calculating 21-day historical volatility 21 trading days into the future. These calculations allow an options buyer or seller to determine the extent to which the VIX (which looks forward 30 calendar days) accurately predicted the realized volatility that occurred during the next 21 trading days or approximately 30 calendar days. The differential (VIX-RV) is plotted as the blue area.

One of the key takeaways from the chart is that at least during the last 2 ½ years, the VIX frequently has been a poor estimator of future volatility. During the October 2008 portion of the financial crisis, the VIX often underestimated future volatility by 30-40 points. Since November, however, the VIX has been consistently overestimating future volatility. In fact, not since February 27th has the VIX expectation of future volatility turned out to be lower than realized volatility 21 days hence.

In other words, if you had been selling SPX options every day since the beginning of March, the dramatic decrease in implied volatility would have almost guaranteed that every day would have been a winning day.

[While I have generally avoided using the term “realized volatility” here, it is synonymous with historical volatility, statistical volatility and actual volatility. All these terms reflect the conventional way of calculating the volatility of a series of changes in price, which is essentially done by taking the natural log of the ratio of daily price changes relative to the mean value for the data series. To the extent that I can avoid confusion, I will try to standardize on using ‘historical volatility’ when looking backward from a specific date and ‘realized volatility’ when looking forward from a date in which there are more recent historical data from which to derive the calculations. For the record, there are actually several ways to calculate historical volatility and one of these days I will finally get around to a series of posts on historical volatility, starting with the calculations…]

For related posts on this subject, readers are encouraged to check out:

DISCLAIMER: "VIX®" is a trademark of Chicago Board Options Exchange, Incorporated. Chicago Board Options Exchange, Incorporated is not affiliated with this website or this website's owner's or operators. CBOE assumes no responsibility for the accuracy or completeness or any other aspect of any content posted on this website by its operator or any third party. All content on this site is provided for informational and entertainment purposes only and is not intended as advice to buy or sell any securities. Stocks are difficult to trade; options are even harder. When it comes to VIX derivatives, don't fall into the trap of thinking that just because you can ride a horse, you can ride an alligator. Please do your own homework and accept full responsibility for any investment decisions you make. No content on this site can be used for commercial purposes without the prior written permission of the author. Copyright © 2007-2023 Bill Luby. All rights reserved.
 
Web Analytics