VIX and Historical Volatility Settling Back into Normal Range
So much has been made lately (here and elsewhere, e.g., Surly Trader) about the extremely steep term structure in the VIX futures that I thought it is important to point out that in terms of current data, the VIX and historical volatility are sitting right in the middle of historical norms.
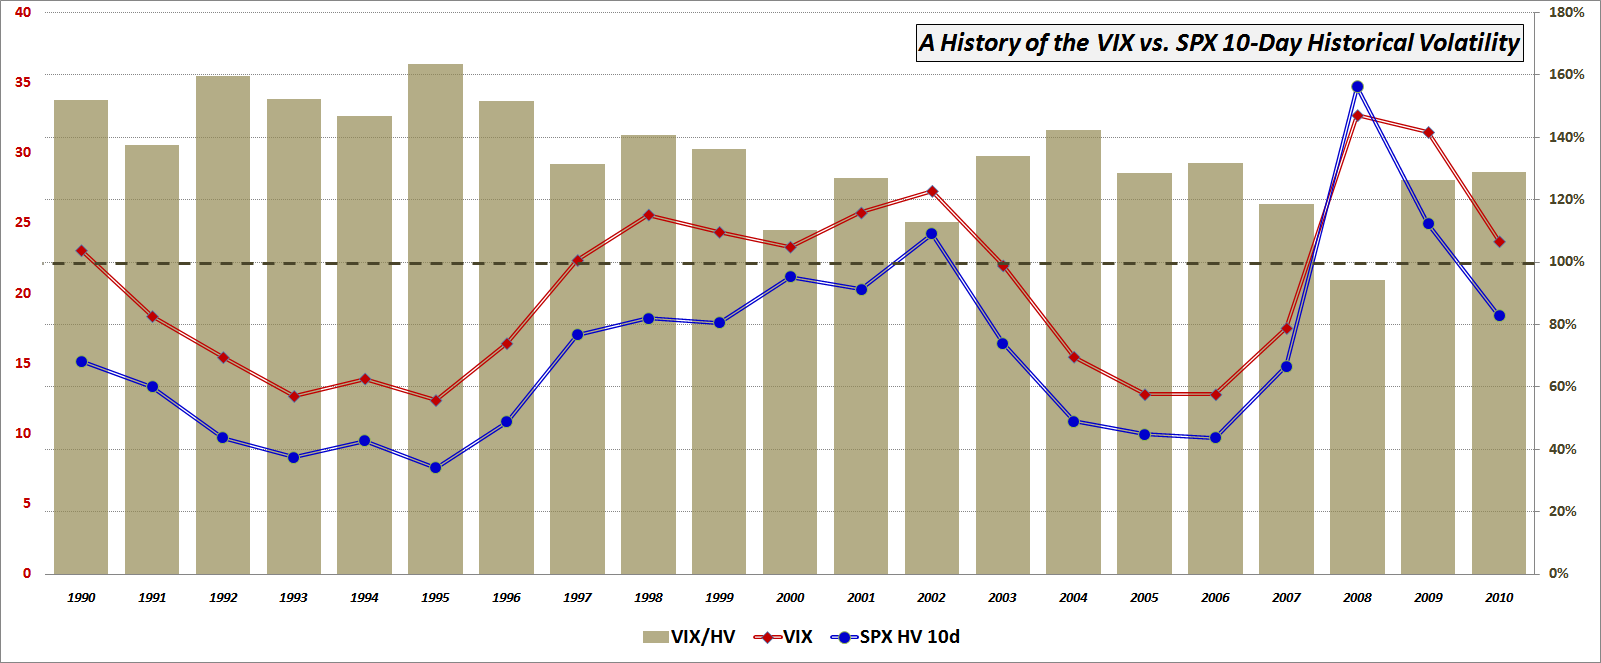
The chart below captures the mean VIX (red line) and mean S&P 500 10-day historical volatility (HV) values (blue line) for each year going back to 1990. In addition, I have added a beige column to show the ratio of the annual means for each year. After an unusual pattern in which the VIX spiked higher than HV in 2008 and remained persistently high relative to HV in 2009 (think “disaster imprinting,”) it now looks as if the relationship between the two is back to the more standard correlation and differential. Note also that the VIX is typically about 35% higher than historical volatility in the SPX, about what has transpired so far in 2010.
So the future may indeed to turn out treacherous enough to warrant that steep VIX futures contango, but for now, but the present looks very much like business as usual.
Related posts (just a few of many):
- Will Market Volatility Return to Crisis Levels? (Barron’s)
- VIX Futures: What Were/Are They Thinking?
- VIX Futures Contango Soars
- More Strange Happenings in the VIX Term Structure
- Today’s Jump in the VIX Futures Term Structure
- Chart of the Week: No More Free Lunch for Volatility Sellers?
- The Gap Between the VIX and Realized Volatility
- Historical Volatility Continues to Plummet
- What Is Historical Volatility?
- Availability Bias and Disaster Imprinting


