Chart of the Week: Gold and the Miners
From a technical perspective, the big event in the markets in the last week is undoubtedly the breakout in the S&P 500 index, but since I devote so much time to the SPX and its derivatives, I thought the time is ripe to recognize gold for hitting a new all-time high and bumping up against $1300 per ounce.
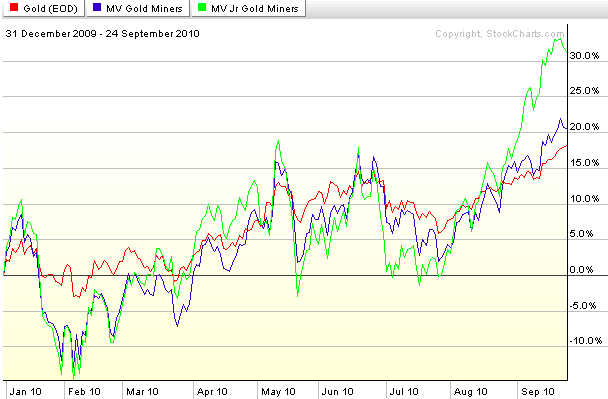
To put a slightly different spin on gold, in the chart of the week below I have elected to include the gold futures continuous contract (red line) and also two popular ETFs for gold miners: GDX, the large cap version (top holdings of ABX, GG and NEM), shown below in a blue line; and GDXJ, the junior gold miners ETF (green line.)
As the chart of 2010 performance shows, gold futures have been the least volatile of the group and have had about the same performance as GDX. While GDX and GDXJ track each other fairly closely, note that GDXJ has distinguished itself with superior performance over the course of the last month or so.
Predicting the future of gold is a daunting task, but if the bullish trend continues, GDXJ clearly has the potential to continue to deliver outsized returns – with commensurate risk, of course.
Related posts:
- Opportunities Arising from Unusually Low Implied Volatility in Gold
- Recent Developments in Gold and Gold Volatility
- Recent Gold Volatility
- Gold and Gold Volatility
- Chart of the Week: Gold
- Chart of the Week: The Flight-to-Safety Trade


